
$99,130 a year, or $47.66 an hour. That's the median annual wage for network and computer systems administrators in the United States as of May 2025, which means half the people in the occupation earned more than that figure and half earned less. The spread around it is wide: the lowest-paid 10 percent earned $62,640 or less, while the highest-paid 10 percent earned $155,050 or more, according to the BLS occupational profile for network and computer systems administrators.
A median tells you where the middle of a mixed group sits. It doesn't tell you what a specific job should pay, because the group it describes runs from someone checking backup logs on a small office firewall to someone designing multi-region cloud networking for a bank. Those two people share a job title and very little else.
What separates them is scope: which systems they own, what happens when those systems fail, and whether anyone else has to sign off before they change something. Pay benchmarking gets useful the moment you stop matching on title and start matching on that.
Table of Contents
- Network Administrator Salary Range at a Glance
- How to Read Percentiles Instead of the Average
- How Pay Changes Across Career Steps
- How Location and Year Shift Network Admin Pay
- How Percentiles Shifted From 2022 to 2025
- Skills and Certifications That Support Higher Pay
- Source Details and What the Figures Leave Out
- Benchmark Your Offer Before You Negotiate
Network Administrator Salary Range at a Glance
The figures describe one occupation, not a family of titles. Network and computer systems administrators, as the U.S. Bureau of Labor Statistics classifies them, install, configure, and maintain organizational computer networks and systems: LANs, WANs, data communications links, operating systems, and both physical and virtual servers. If a job involves switch configuration, firewall rules, patching, or backup verification, it probably fits the classification.
| Percentile | Annual wage |
|---|---|
| 10th percentile (lowest 10% earn) | $62,640 or less |
| 25th percentile | $78,010 |
| Median (50th percentile) | $99,130 |
| 75th percentile | $126,640 |
| 90th percentile (highest 10% earn) | $155,050 or more |
The middle two quartiles run from $78,010 to $126,640, a band $48,630 wide. Most real offers land somewhere inside that band, which is why a single published network administrator salary is a weak negotiating tool on its own. The median is where the group's weight sits, not where any particular job should be priced.
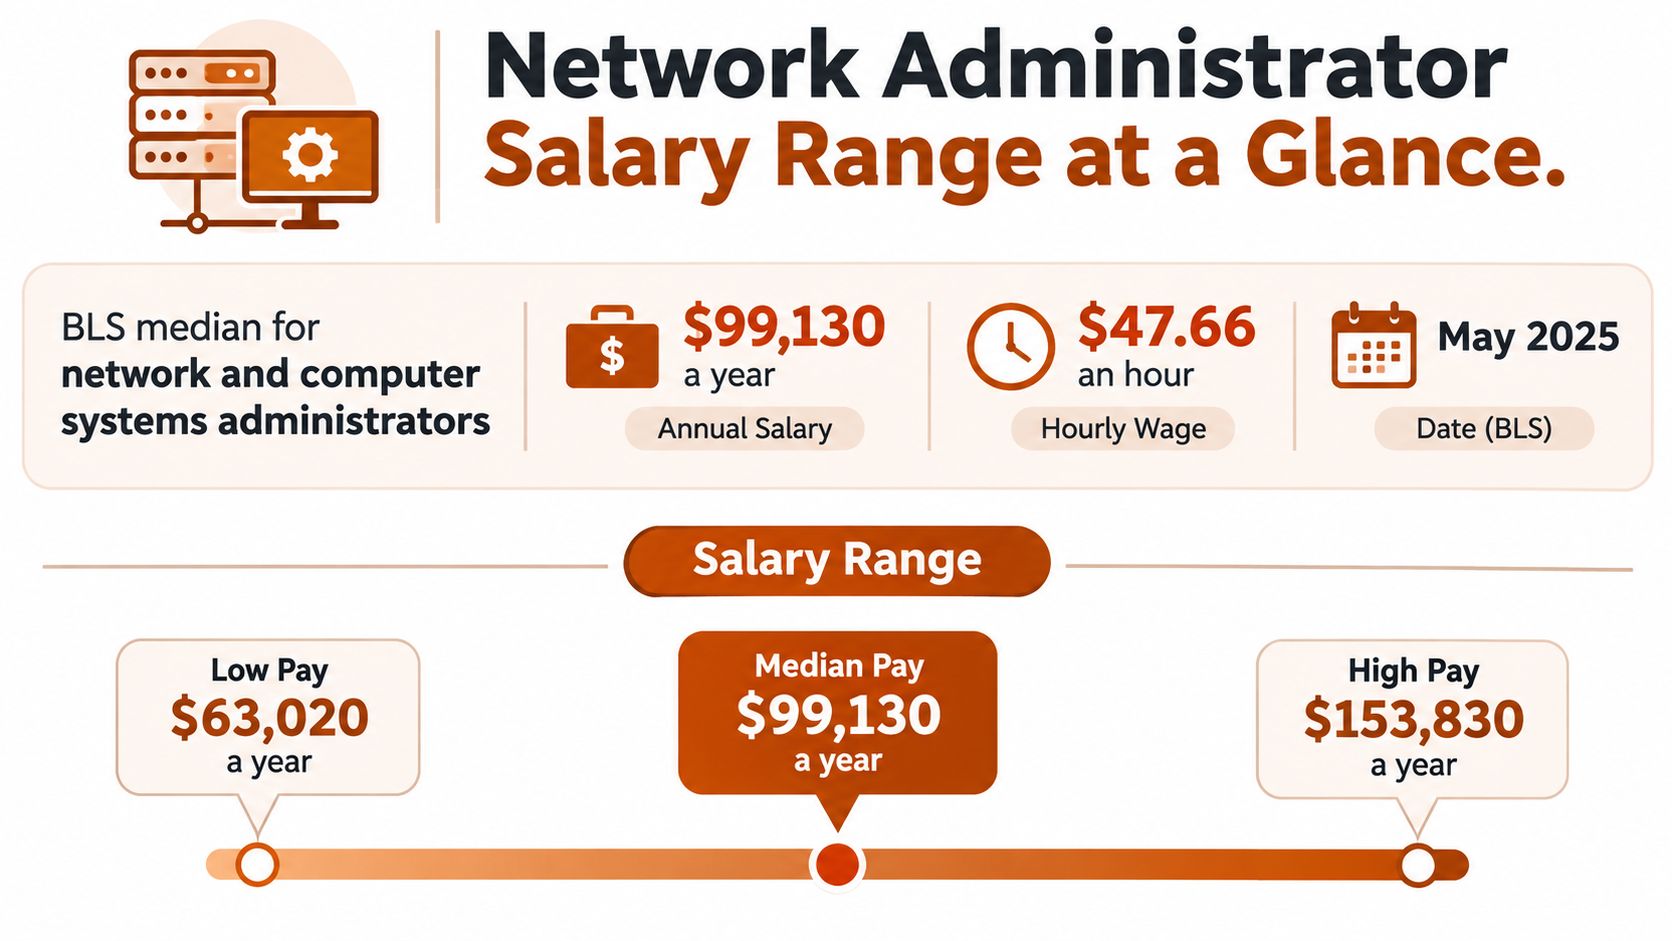
The same BLS wage distribution shows what moves a person up the ladder: experience, employer size, industry, geography, certifications, and responsibility. Two administrators in the same city with the same title can sit a full quartile apart. One keeps a 40-person office LAN running on a single firewall; the other owns a multi-site WAN with a 24/7 on-call rotation and a disaster-recovery obligation.
Find your rung before you compare yourself with the headline number. Locate where your own responsibilities sit on that ladder, then compare your pay with that rung rather than with the midpoint of a group. And keep the scope of the figures straight: these are pre-tax US national base wages for May 2025, not local market rates and not total compensation.
How to Read Percentiles Instead of the Average
A percentile ranks a wage against the rest of the occupation. The 25th percentile of $78,010 means one in four network and computer systems administrators earned less than that, and three in four earned more. The 75th works the same way in reverse. The median is the 50th percentile, the point that splits the group in half.
The median isn't an average. A handful of unusually high salaries can't drag it upward the way they drag a mean, which is why a percentile ladder is a sturdier benchmark than a single advertised "average salary for network administrators" figure circulating on job boards.
Run the arithmetic on your own offer
Say an offer lands at $85,000. Divide by 2,080 (40 hours a week across 52 weeks) and it's $40.87 an hour. Do the same with the 25th percentile: $78,010 becomes roughly $37.50. The offer sits above the 25th percentile and below the median, so it's under the national midpoint for this occupation.
Two adjustments matter before you draw a conclusion. Contractors working on a 1099 basis need a higher headline rate than salaried staff, because that rate has to absorb self-employment tax, benefits, and unpaid time off. Salaried staff should compare total packages, since bonus, on-call pay, and benefits change the value considerably.
What the low and high ends represent in practice
The lower percentiles usually reflect narrower scope: documented monitoring, patching, ticket queues, backup checks, and in smaller companies a share of someone's broader IT role. The upper percentiles usually reflect ownership: capacity planning, security architecture coordination, vendor decisions, and accountability for whether recovery works. The BLS doesn't tag each percentile with a job level, so treat the ladder as a description of a mixed population, not a promotion sequence.
Rule to apply: decide which percentile your scope of work matches, then compare your pay with that point. The median alone will mislead you in both directions, flattering a narrow role and underselling a broad one.
How Pay Changes Across Career Steps
Almost nobody is hired straight into the network architect seat. The usual route runs from help desk or network support into a network administrator or engineer role, then to senior engineer, and only then to architect. Each jump is defined less by the title than by what the person is trusted to own when something breaks at 2 a.m.
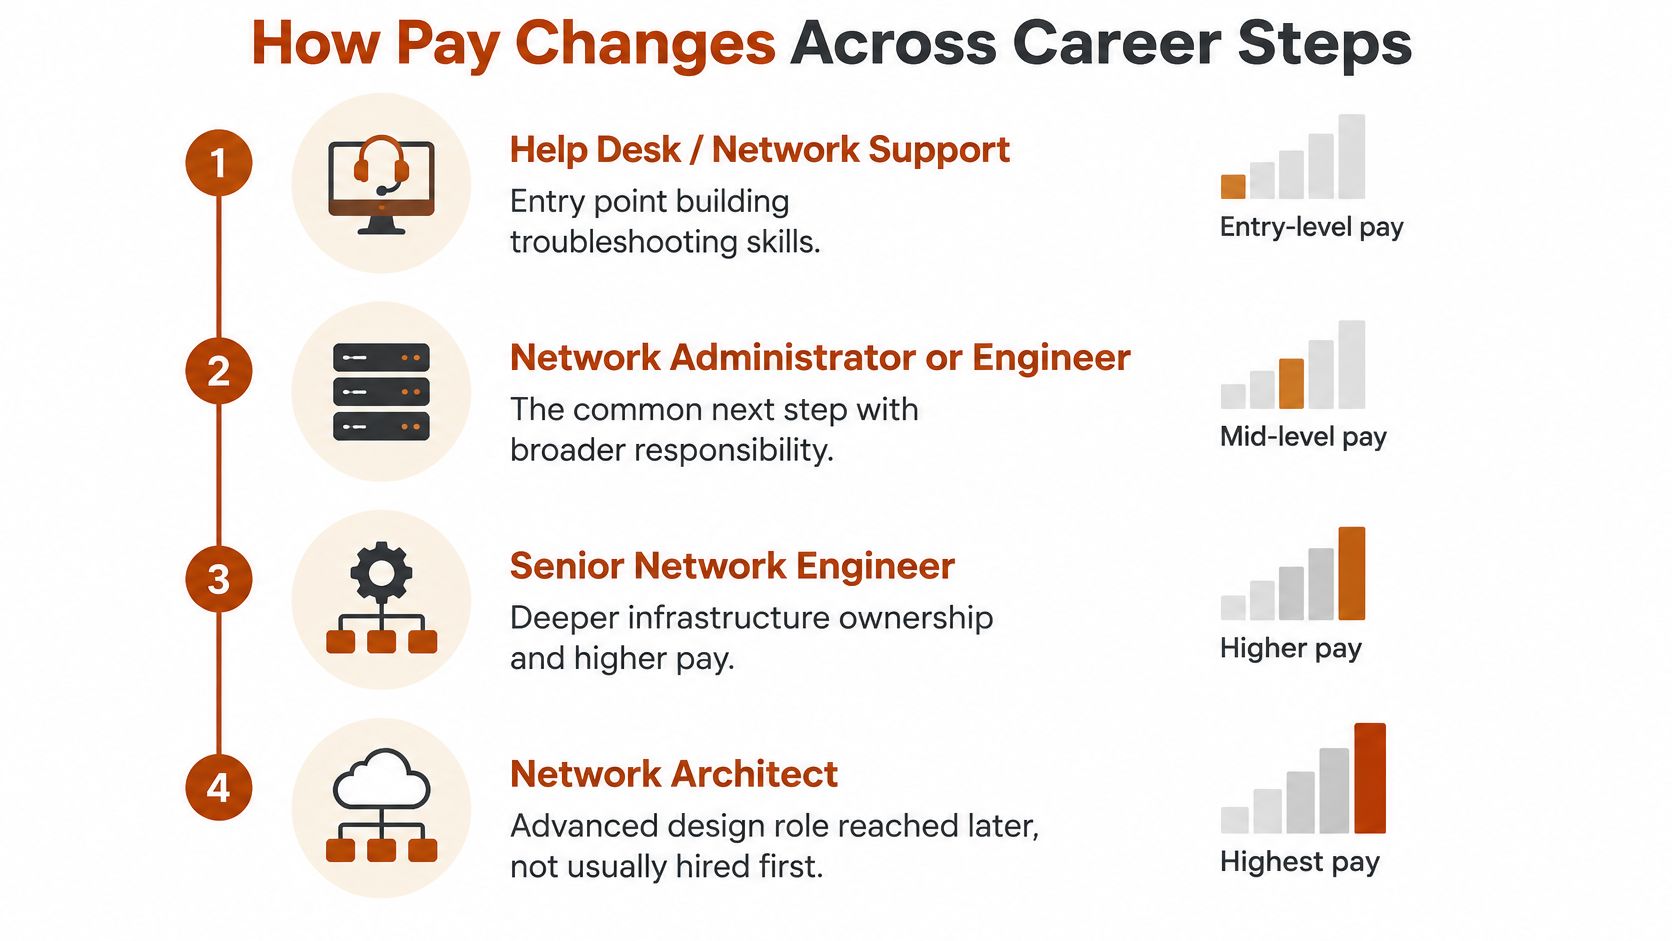
Entry-level work centers on execution against a runbook: monitoring alerts, patching on schedule, clearing tickets, verifying that last night's backup completed. Mid-level administrators troubleshoot production incidents without escalation, manage access controls, and maintain virtualization or cloud infrastructure. Senior engineers own capacity planning, access-control design, and the aftermath of an outage. Architects own the overall design, coordinate with security on architecture, and make vendor decisions that commit budget for years.
| Career step | Typical scope | Reference pay |
|---|---|---|
| Help desk or network support | Endpoint support, ticket resolution, documented monitoring and backup checks | Median $61,860 for IT support |
| Network administrator | Installing, configuring and maintaining LANs, WANs and servers; troubleshooting incidents | Median $99,130 (BLS, May 2025) |
| Senior network engineer | Capacity planning, access control design, incident ownership | No separate BLS median; priced between the administrator and architect bands |
| Network architect | Overall network design, security architecture coordination, vendor decisions | Median $134,050 (BLS, 2025) |
The architect step has its own reference point. Computer network architects had a median of $134,050 in 2025, and information security analysts a median of $129,180, according to the same Bureau of Labor Statistics occupational outlook data. Those two figures are useful when an administrator role carries heavy security or design responsibility: if the work looks closer to either occupation, pricing it at the administrator midpoint underpays it.
Mojolin's network architect page lists a bachelor's degree and five or more years of experience as the typical entry requirement for that step, which is a fair signal of how much runway sits between an entry administrator job and architecture. The senior engineer step in between has no separate BLS median, so benchmark it by the scope the person holds rather than by the label on the door. The title overlap between adjacent roles is real, and systems administrator versus network administrator is worth checking if the job description mixes server and network duties.
Match your own responsibilities to a step before you match your title to one. Plenty of people carry "network administrator" on a badge while doing entry-level work, and plenty carry "IT specialist" while owning architecture.
How Location and Year Shift Network Admin Pay
Two comparisons do most of the work here. Nationally, the median moved from $96,800 in 2024 to $99,130 in 2025, an increase of $2,330 or about 2.4%. In California, the 2024 median was $106,620, which is $9,820, or roughly 10.1%, above the national figure for the same year.
| Measure | Year | Median annual wage |
|---|---|---|
| National median (BLS) | 2024 | $96,800 |
| National median (BLS) | 2025 | $99,130, up $2,330 or about 2.4% |
| California median (BLS) | 2024 | $106,620, about $9,820 or 10.1% above national |
Why two states pay differently for the same work
Location isn't a cost-of-living adjustment bolted onto a national number. Local labor markets set the floor: how many employers with real network infrastructure sit within commuting distance, whether those employers compete for the same candidates, and whether the role requires on-site presence or an on-call rotation. A dense metro with several large employers and a thin supply of experienced engineers pays differently from a rural market where the same scope of work is one of three such jobs in the county.
The national median therefore understates pay in high-cost states and overstates it in lower-cost ones. A candidate in a coastal metro who benchmarks against $99,130 may be leaving real money on the table; a candidate in a small market who treats the same figure as a floor may be asking for a number the local employer can't support.
Year matters too. A 2.4% move in twelve months means a two-year-old figure is stale by roughly that much again, and a five-year-old figure is a historical curiosity. Job boards recycle old salary surveys constantly, and a listing that quotes a pre-2024 number is quoting a different labor market.
Method: start with the national median for the occupation, apply the difference your state or metro shows, then check whether your scope matches the level you're benchmarking. If the scope doesn't match, the geography work is wasted.
How Percentiles Shifted From 2022 to 2025
The earlier BLS wage table for this occupation gives a second view of the same ladder. In May 2022, the 10th percentile was $56,260, the median was $90,520, the 75th percentile was $115,070, and the 90th percentile was $140,430, according to the BLS May 2022 occupational wage data for network and computer systems administrators.
| Percentile | May 2022 | May 2025 |
|---|---|---|
| 10th percentile | $56,260 | $62,640 or less |
| Median | $90,520 | $99,130 |
| 75th percentile | $115,070 | $126,640 |
| 90th percentile | $140,430 | $155,050 or more |
Where the growth landed
In dollars, the gain grows as you climb. The 10th percentile rose about $6,380, the median about $8,610, the 75th about $11,570, and the 90th about $14,620. Senior bands moved the most in absolute terms, which is what you'd expect when the premium for ownership rises faster than the premium for execution.
In percentage terms the pattern flips. The 10th percentile rose roughly 11.3%, the median about 9.5%, the 75th about 10.1%, and the 90th about 10.4%. The lower tail rose fastest, so the bottom of the range gained ground on the middle over the period. Roles that used to sit clearly below the median were pulled closer to it.
Those 2025 figures are reported as bounds, $62,640 or less and $155,050 or more, so treat the changes at the outer percentiles as approximate. Use the 2022 table only to understand the shape and direction of movement. It predates the 2025 data and shouldn't be quoted as a current benchmark for any offer.
Skills and Certifications That Support Higher Pay
Certifications don't set pay. They shift it by making a specific kind of ownership visible to a hiring manager who can't see your last six months of work. The credential is evidence, and evidence only helps when it documents scope the employer needs to fill.
That distinction explains why the same certificate appears in a $70,000 job posting and a $120,000 one. A CCNA in a help desk candidate signals that the person can be trusted with switch and routing work, which grants administrator-level responsibilities. The same CCNA in an experienced engineer's file adds little, because the work history already says it.

Credentials as evidence of scope
- Cisco CCNA: documents network fundamentals and vendor configuration, the common early milestone for candidates moving from support into administrator territory.
- CompTIA Linux+ and Red Hat RHCSA: document server ownership. They matter when the role includes maintaining Linux hosts, not just talking about them.
- CompTIA Security+: documents that the person can hold access-control and security-review duties, which appear in most administrator job descriptions now.
- Certified Kubernetes Administrator (CKA): documents container platform ownership, a scope that sits well above traditional network administration.
- Cloud networking credentials from AWS, Azure or Google Cloud: document that the person can design and troubleshoot network segments inside a cloud provider, which is increasingly expected of senior engineers and architects.
The pattern is that each credential maps to a duty, not to a raise. A certificate for a duty the role doesn't include buys nothing in a negotiation.
Build the argument from your own record instead. List two or three pieces of evidence from your work, such as an incident you resolved end to end, a backup restore you tested and documented, or an access review you ran, and pair each with the credential that best documents it. Anyone weighing whether a specific networking certificate is worth the time and exam fee should read whether the CCNA is worth it before booking a test date.
Own the outcome, then document it. A certificate with no incident behind it is a receipt for a course.
Source Details and What the Figures Leave Out
Every median and percentile here comes from the U.S. Bureau of Labor Statistics occupational profile for network and computer systems administrators, using May 2025 wage data for the current figures and a May 2022 wage table for the trend comparison. Knowing what those sources measure is as important as knowing the numbers.
Three limits worth naming
The wages are national base pay. Equity grants, signing bonuses, and benefits sit outside the figure. A role with a modest base, a real annual bonus, and paid on-call hours can beat one with a higher base and nothing else attached.
The occupation mixes junior and senior people under one title. A percentile is a position in that mixed group, not a confirmed job level. Two employers using the same title for very different scope will both feel accurately described by the same percentile, which is exactly the problem.
The figures are US labor-market data expressed in US dollars. Mojolin's role pages carry the same scope, so a reader benchmarking a role in another country should treat these numbers as a direction rather than a target and find local survey data for the actual comparison.
One more gap matters for offers: the median is a national midpoint, not a guaranteed rate. Organization size, on-call requirements, security responsibilities, cloud-platform ownership, and the distinction between infrastructure administration and network architecture all shift what an employer will pay and what a candidate should accept.
Citation rule: quote the figure, the data year, and the occupation name together. "Median of $99,130 for network and computer systems administrators in May 2025 BLS data" is defensible in a budget meeting. "$99,000 for network admins" isn't, and someone will ask.
The 2022 percentile comparison illustrates movement over time, but that table comes from an earlier survey and predates the 2025 median. Use it to understand where growth concentrated, never as the current figure for a live offer.
Benchmark Your Offer Before You Negotiate
The procedure below turns a public wage distribution into a number you can defend in a conversation with a hiring manager or a finance team. Work through it in order, because each step constrains the next.
- Define your scope in writing. List the systems you own, the incidents you resolve without escalation, and whether you hold access control, backup verification, or cloud platform ownership. Titles vary wildly between employers, so scope is the only reliable input.
- Map that scope to a career step. Use the career table earlier in this guide to place yourself. This sets your level before a single pay figure is read, which prevents the common error of starting from the median and arguing backward.
- Pick the matching percentile. Entry-level scope belongs near the lower percentiles. Independent troubleshooting and infrastructure ownership land near the median. Ownership of capacity planning, security architecture, or vendor decisions belongs in the upper range.
- Adjust for place and year. Apply your state or metro difference, then check the data year. A national median that rose about 2.4% in a single year makes older figures unreliable quickly, and job-board averages rarely disclose their survey year.
- Compare total compensation, not base alone. Add bonus, on-call pay, shift differentials, and benefits to the offer. On-call duty changes the actual value of a role considerably, and it's usually the item left out of a base-salary comparison.
- Record the figure, the year, and the source. Write them down together, in the same note as your scope list. A number you can't attribute is a number you can't use when someone pushes back.
Mojolin profiles 14 tech roles with pay, job counts, and a ten-year outlook from U.S. Bureau of Labor Statistics data, which is a practical way to see how a network administrator figure compares with adjacent roles such as systems administrator, IT support, or network architect before you settle on a target.
The decision at the end of the process is a single sentence: set a target inside the percentile band your scope matches, and name the specific responsibilities that justify it. That sentence is what turns a public median into a raise. Mojolin's tech salary negotiation guide covers how to carry that sentence into the conversation without turning it into a confrontation.
Mojolin publishes sourced pay, employment, and outlook data for 14 technology roles, all drawn from U.S. Bureau of Labor Statistics figures, so the percentile you settle on can be checked against the roles either side of yours. If you're preparing for a review or an offer, start with the role pages to see where network administration sits relative to systems administration, IT support, and network architecture, then carry the numbers into the negotiation. Visit Mojolin to compare the figures and build the case for your own scope of work.