In May 2025, the Bureau of Labor Statistics median for US management occupations was $126,520, about 2.48 times the $50,980 median for all occupations, and that figure is a median, not an arithmetic average.
A hiring manager who treats one manager average salary as the going rate will misprice the seat. The management group mixes a first-time supervisor with a function head, and a specialty inside that group can sit tens of thousands of dollars away from the broad midpoint. One common title, general and operations managers, hides a spread from the 10th percentile to the 90th that is roughly five times the lower wage. Technology management sits on a separate premium again, because the work adds systems risk and investment decisions, not just a team to lead.
The defensible path is to name the occupation, read the midpoint for the right year and survey, then set a band for level and scope. Incentives stay on their own lines. What follows is that reading, with the survey and the year attached to every wage a recruiter or a candidate might quote.
Table of Contents
- Manager Median Pay by Occupation
- Why the Average Manager Salary Overstates Typical Pay
- Technology Manager Pay Above the Baseline
- Matching the Year and Series Before You Compare
- What Official Manager Wages Leave Out
- Build a Manager Salary Range You Can Defend
Manager Median Pay by Occupation
The Bureau of Labor Statistics Occupational Outlook Handbook reported a May 2025 median annual wage of $126,520 for the broad management-occupations group in the United States. The same release put the median for all occupations at $50,980, so management pay was about 2.48 times the overall occupational median.
Those handbook figures are medians, not arithmetic averages. Half of workers in the covered management occupations earned more than $126,520 and half earned less. The category aggregates many manager types, so it is a baseline for management work overall, not a salary that belongs on every posting that uses the word manager. Specialization, industry, employer size, geography, experience, and responsibility all move the number.
| Occupation | Median annual wage | Period | How to read it |
|---|---|---|---|
| All occupations | $50,980 | May 2025 | Baseline for every job, not just managers |
| Management occupations | $126,520 | May 2025 | Broad benchmark; half of managers earned more, half less |
| Computer and information systems managers | $175,140 | May 2025 | Technology-management anchor for base pay |
The technology row sits $48,620 above the broad management median. That gap is why a single manager average salary misleads before anyone argues about bonuses. An occupation-specific median can differ by tens of thousands of dollars inside the same month of data. The handbook also reports May 2025 medians of $166,570 for financial managers and $149,280 for human resources managers. Finance and HR are still management work. They are not the same market as a general operations seat or a systems seat.
Mean versus midpoint in the same group
People who type "average" usually want the arithmetic mean. For 2023, BLS Occupational Employment and Wage Statistics reported a mean annual wage of $137,750 for management occupations. BLS Career Outlook reported a 2023 median of $116,880 for US management occupations. Within that pair, the mean sits above the median. Higher-paid managers pull the arithmetic average up, so the mean describes a pulled total, not the middle worker.
Practical rule: Pick the row that matches the job's work, not the word manager on the posting. Use the management-group median only as a baseline for comparison.
A posting that says manager and then describes a service lead, a finance function, or enterprise systems is three different jobs. Tech salaries by role line technology titles up against each other instead of blending them into one management average. For a hire or a career check, start with the narrower occupation. Keep $126,520 as the comparison line, not the offer.
Why the Average Manager Salary Overstates Typical Pay
Average and typical pay are not the same number. General and operations managers show how one title hides the spread. In the BLS May 2023 Occupational Employment and Wage Statistics estimates, the occupation included about 3,507,810 jobs, a mean annual wage of $129,330, and a median annual wage of $101,280. The mean exceeded the median by $28,050, because relatively high-paid managers pulled the arithmetic average upward.
The wage distribution for that single title looks like this.
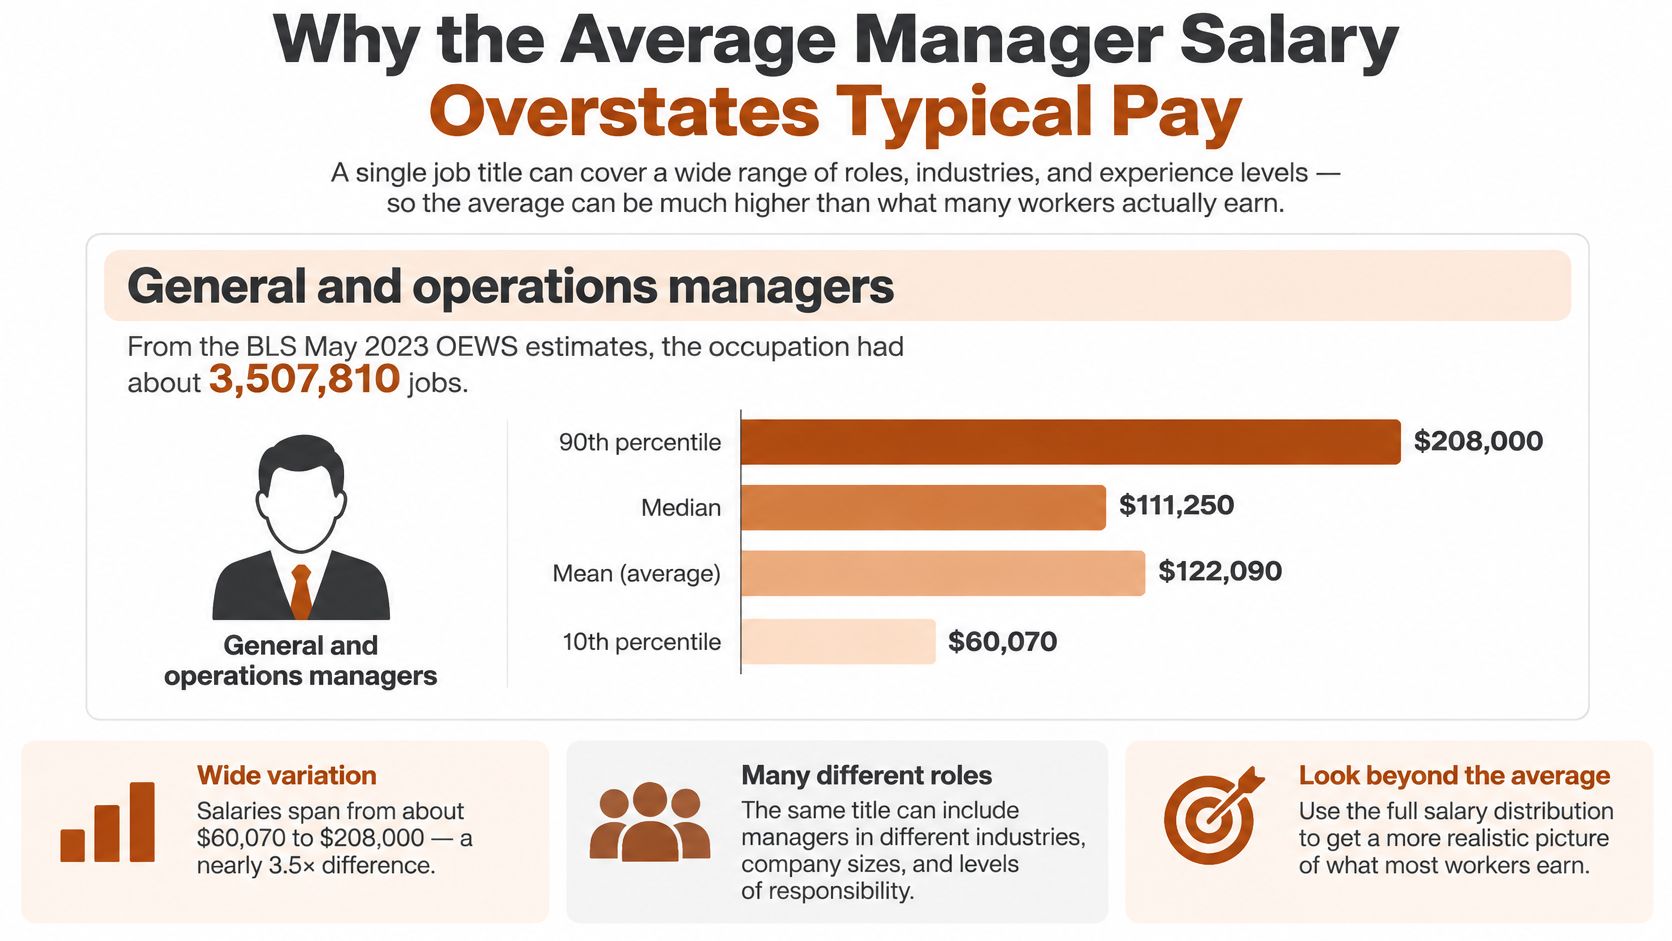
Walk the annual percentiles in order. The 10th was $46,340, the 25th $65,180, the median $101,280, the 75th $160,290, and the 90th $232,110. The gap from the 10th to the 90th was $185,770, roughly five times the lower figure. Someone at the top of that band isn't a slightly senior version of someone at the bottom. Scope, market, and performance expectations have already changed the job.
| Measure | 10th percentile | 25th percentile | Median | 75th percentile | 90th percentile |
|---|---|---|---|---|---|
| Annual wage | $46,340 | $65,180 | $101,280 | $160,290 | $232,110 |
| Hourly wage | $22.28 | $31.34 | $48.69 | $77.06 | $111.59 |
What the hourly line says
The published hourly estimates follow the same shape: $22.28 at the 10th percentile, $48.69 at the median, and $111.59 at the 90th percentile. The 25th and 75th hourly cells above aren't a second published series. They are those annual wages divided by 2,080 hours, which lands near $31.34 and $77.06. Use them as a check on the annual band, not as a separate BLS release.
Think of the mean as the bill after a few very expensive dinners join the table. The median is the middle diner. Quote the median when someone asks for typical pay. Use a percentile band when seniority, market, or scope should move the offer. A new general manager in a small operation belongs nearer the lower half of this spread. A multi-site operator with budget authority belongs nearer the upper half. Neither person is described by $129,330.
The short walk-through below is a useful reminder that a single average flattens a distribution. It doesn't replace the percentile table when you set a range.
"Average manager salary" is not interchangeable with typical pay. A median describes the midpoint worker. Percentiles set the range.
Technology Manager Pay Above the Baseline
The technology premium comes first. The BLS profile for computer and information systems managers reported a May 2025 median annual wage of $175,140. That is about 38% above the $126,520 median for management occupations overall, and more than three times the $50,980 median for all occupations.
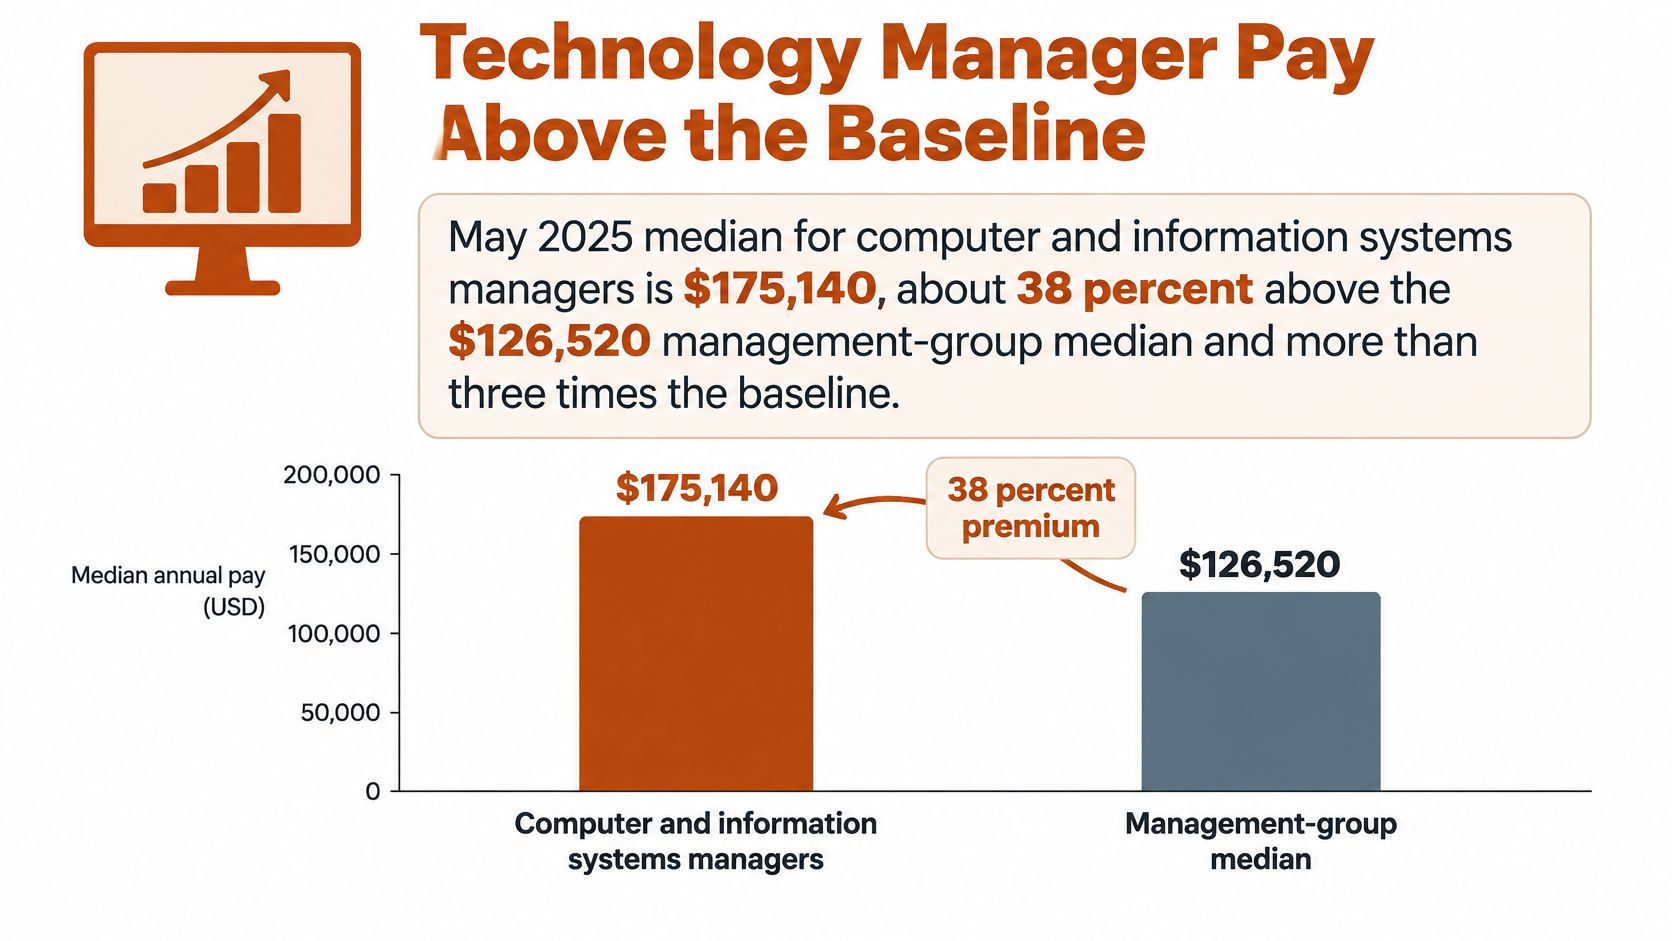
The premium is scope, not a title bonus. These managers combine personnel leadership with cybersecurity and infrastructure risk, technology investment decisions, and responsibility for business-critical systems. A hiring team that copies $175,140 onto every "IT manager" req will overpay a small service desk and underpay enterprise security. The occupation is one statistical bucket. The jobs inside it are not.
Classify the work before you copy the median
- Decide whether the role manages technical delivery, enterprise systems, security, data, or engineering. The IT manager role is the right anchor only when the work matches that occupation, not when the posting merely mentions technology.
- Adjust that occupational benchmark for location, team size, budget authority, on-call exposure, and how scarce the required skills are. A national median doesn't know your metro or your pager rotation.
- Check the adjusted figure against the scope in the job description, not the title alone. If the description is a service desk plus vendors, don't price it like an engineering organization.
Use $175,140 as the starting market anchor for base pay. It isn't a complete compensation target. Senior technology managers may receive substantial annual incentives, equity, or retention awards that the published median doesn't include. Price those on separate lines after the base is set. A technology manager running a small service desk and one running enterprise security sit at different points in the same occupation, so the classification step decides where in the range the offer belongs.
Matching the Year and Series Before You Compare
A weekly earnings median and an annual occupational wage can differ sharply without either being wrong. In 2023, full-time U.S. workers in management occupations had median weekly earnings of $1,730, according to the BLS Current Population Survey. Multiplying by 52 gives $89,960, well below the 2023 occupational median of $116,880 and the May 2025 management median of $126,520.
The weekly figure comes from a household survey of full-time workers. Occupational Outlook Handbook medians use an employer wage survey and are reported annually. Annualizing weekly earnings does not make the two measures comparable.
| Series | Value | Note |
|---|---|---|
| Management occupations weekly median, 2023 (CPS) | $1,730 per week | Household survey of full-time workers; 52 weeks equals $89,960, not an OEWS annual wage |
| Management occupations median, 2023 (OEWS) | $116,880 per year | Annual employer-survey median |
| Management occupations median, May 2025 (OEWS) | $126,520 per year | Annual employer-survey median |
| Human resources managers median, 2023 (OEWS) | $136,350 per year | Annual; 2023 OEWS estimate, so compare against the latest OEWS release |
Two annual medians, still not one series to subtract
The 2023 management median of $116,880 and the May 2025 median of $126,520 are both annual employer-survey figures, but they come from different release years. Treat the newer figure as the more current benchmark rather than interpreting the difference as a direct measure of wage growth. Survey methods, occupation coverage, and the time between releases can all affect the comparison.
Human resources managers show why the year matters. The U.S. median annual wage for the occupation was $136,350 in 2023, according to the BLS OEWS estimate for human resources managers. A current salary band should use the most recent OEWS median for the occupation, rather than a 2023 figure adjusted by a flat percentage.
The 2023 mean for Managers, All Other was $146,320, according to the BLS residual-manager estimate. That is a different occupational group from human resources managers. Combining the two figures would produce a benchmark for neither occupation.
Match the series, year, and pay period before comparing manager wages. A weekly household-survey figure and an annual employer-survey figure cannot establish a raise or pay gap on their own.
What Official Manager Wages Leave Out
Every wage in this article carries three limits, and each one changes an offer even when the occupation is correct.
BLS wages published this way are national US figures. Mojolin's role pages use the same US scope. They don't reflect local cost of living, and this article doesn't add city or industry differentials the handbook doesn't publish. They exclude equity, signing bonuses, and benefits. They also mix junior and senior people under one job title. Mojolin's pay, employment, and outlook figures come from the US Bureau of Labor Statistics Occupational Outlook Handbook, the edition with 2025 pay and 2025 to 2035 projections. Cite that edition and year next to every number you lift into a memo.
A national midpoint isn't a local director
A median such as $126,520 or $175,140 is base pay for a national mix. A director with budget authority in a high-cost metro isn't the same worker as a first-time manager in a smaller market. The handbook won't hand you a city adjustment. You still have to write one, and you should label it as your adjustment, not as a BLS wage. Leaving the national figure untouched and calling it "market" is how offers miss in both directions.
Cash wages aren't the package
Bonus, equity, and benefits can move total compensation without changing the published wage. Senior technology managers often receive incentives or retention awards outside the median. If those dollars get folded back into the base so the offer "matches BLS," the base stops being comparable to the survey and the incentive stops being manageable. Keep the survey wage as base. Put variable pay and equity on their own lines, with the trigger and the vesting written down.
One title, many years of experience
Because the title blends experience levels, the median is a midpoint of the survey, not the correct offer for year one or year fifteen. A first-time manager priced at the occupation median is being paid as if they were already the middle of a national mix of seniors. A long-tenured manager priced only at that median is being treated as if scope never grew. The anchor stays. The offer moves off it for level and for place, and incentives stay separate from base.
Build a Manager Salary Range You Can Defend
A range you can defend is a short sequence, not a new average. Finish it in one sitting, and label every figure that leaves your notes.
- Name the occupation, not just manager, and take its May 2025 median from the lookup above. If the posting can't be matched to an occupation, the range isn't ready.
- If the work is technology management, start at $175,140 rather than the broad management median. IT managers have a median annual pay of $175,140, the highest of the tech roles Mojolin tracks. Then apply the classification step: delivery, enterprise systems, security, data, or engineering, adjusted for location, team size, budget, on-call load, and scarce skills.
- Treat the median as base pay and set a band for level. Newer managers sit toward the lower part of that occupation's spread. Broader scope sits toward the upper part. The general and operations percentiles are only a picture of how wide one manager title can be. Don't paste that occupation's 10th or 90th onto a different job.
- Add bonus, equity, and benefits as separate lines so they aren't hidden inside the BLS wage. A candidate can accept a base at the median and still be under the market once incentives at peer companies are counted, or the reverse.
- Label the year and the source on any number that goes into a job post or a negotiation note. A 2023 weekly CPS figure and a May 2025 annual OEWS median don't belong in the same cell.
For a side-by-side view of that technology-manager anchor with other tech roles, Mojolin profiles 14 tech roles with pay, job counts, and a ten-year outlook from US Bureau of Labor Statistics data. Each role page compares that role's median pay against the other 13 roles Mojolin tracks, which keeps unrelated manager titles from being averaged together. The pay negotiation guide is the place to turn that band into an anchor, a base, and a separate incentive line before the first conversation with a candidate.
Mojolin publishes US technology pay, job counts, and outlooks drawn from the Bureau of Labor Statistics Occupational Outlook Handbook, so a manager average salary can be checked against a named occupation instead of a blended title. The role pages and the pay-and-negotiation guides are built for candidates setting an expectation and for hiring teams writing a range they can explain. Visit Mojolin to compare the IT manager median with the other tracked tech roles before you lock a number.