A data scientist salary in NYC looks high until the reader asks which worker, which employer, and which part of the pay distribution the headline describes. The market median is not a first offer, and the lower tail sits far below it. Reading the percentile bands, the geography, and the compensation scope together gives a more useful answer than any single average.
Table of Contents
- New York City Data Scientist Pay at a Glance
- Why the New York Metro Pays More Than the State
- Pick the Right Benchmark for Your Own Offer
- What Moves an Offer Within the Range
- Public and Private Employer Pay Compared
- What the Figures Leave Out and How to Read Them
- How to Anchor Your Number in a Negotiation
- Set Your NYC Salary Range Before You Apply
New York City Data Scientist Pay at a Glance
Every figure used in this guide appears below with its measure, geography, and year. Keeping those labels attached prevents a metro median, a statewide mean, and a self-reported city average from being treated as the same number.
| Measure | Annual figure | Geography | Year |
|---|---|---|---|
| BLS 10th percentile | $79,870 | New York–Newark–Jersey City metro | May 2025 |
| BLS 25th percentile | $101,320 | New York–Newark–Jersey City metro | May 2025 |
| BLS median | $135,980 | New York–Newark–Jersey City metro | May 2025 |
| BLS 90th percentile | $216,030 | New York–Newark–Jersey City metro | May 2025 |
| BLS mean | $141,460 | New York–Newark–Jersey City metro | May 2023 |
| BLS mean | $134,830 | New York State | May 2023 |
| BLS national median | $120,230 | United States | May 2025 |
| Built In average salary, employee-reported | $141,712 | New York City | 2026 |
| City of New York posting range | $87,743 to $100,904 | City of New York | 2026 |
What Each Row Measures
The 10th percentile marks a point near the bottom of the metro wage distribution, while the 25th percentile marks the lower quarter. The median is the midpoint, meaning half of workers in the estimate earn more and half earn less. The 90th percentile marks the upper end, where only a small share earn more.
The metro and statewide means are averages from an earlier year, so they answer a different question from the later median. The national median provides countrywide context, not a New York benchmark. Those distinctions matter because a mean can sit above the median when high earners pull the average upward.
The Built In salary page for New York City data scientists reports an average salary of $141,712 in 2026, with average additional cash compensation of $20,480, from anonymous employee responses. That basis differs from a government occupational survey. The City of New York row is narrower still, because it's one employer's posted range rather than a market estimate.
The metro geography covers the tri-state labor market, including New York City, northern New Jersey, and parts of Pennsylvania, rather than the five boroughs alone. A posting in Manhattan, Jersey City, or another commuting location may therefore compete in the same broad market even though the workplace address differs.
Reading rule: Start at the median for orientation, move to the band matching experience and scope, and keep the year and source beside every number quoted.
That rule avoids the most common shortcut, which is copying the largest or most familiar figure into an application. A candidate's realistic benchmark depends on where that candidate plausibly sits in the distribution, not on the midpoint for all workers combined.
Why the New York Metro Pays More Than the State
The Bureau of Labor Statistics May 2023 Occupational Employment and Wage Estimates counted approximately 16,330 data scientists in the New York–Newark–Jersey City metro area and 16,390 statewide. The metro figure equaled 1.72 jobs per 1,000 local jobs, with a location quotient of 1.36. That means the occupation was about 36% more concentrated there than in the United States overall.
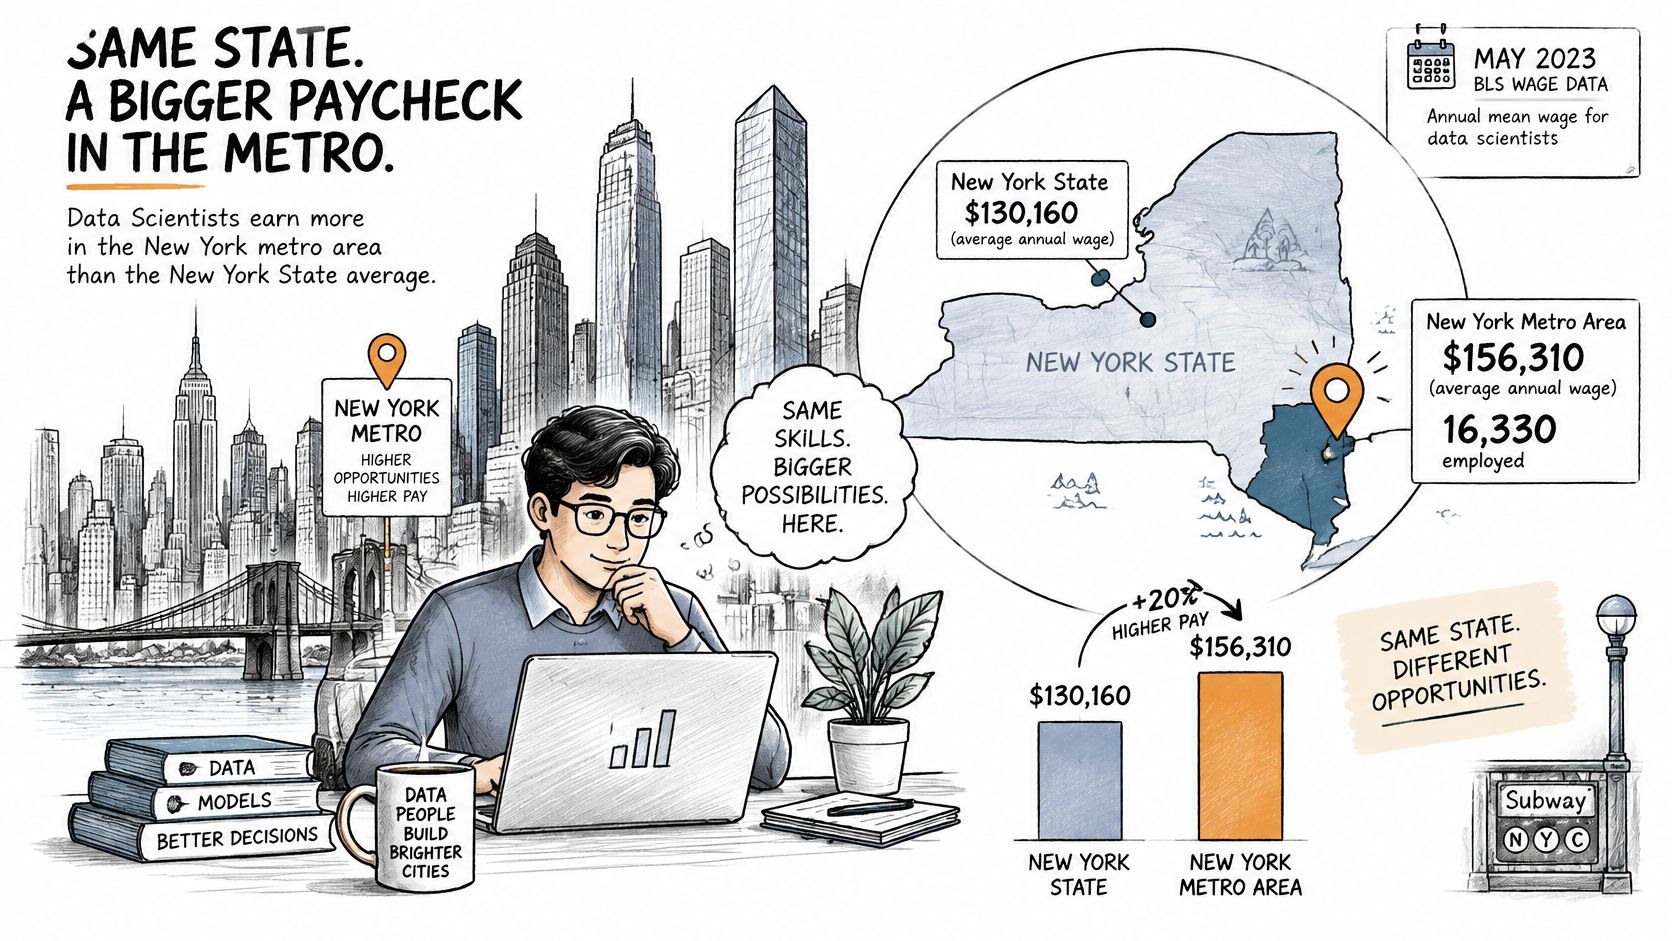
The metro mean annual wage was $141,460, compared with $134,830 statewide. The difference is $6,630, or roughly 4.9%. Because the metro count is nearly the statewide count, the state average largely reflects the same regional market, diluted slightly by jobs elsewhere in New York.
What the Premium Does Not Prove
The premium doesn't show that every employer inside the five boroughs pays more than every employer elsewhere. It describes an average across a region that includes New York City, northern New Jersey, and parts of Pennsylvania. Employers across that commuting area compete for overlapping talent pools, which helps explain why the regional figure is the relevant benchmark for many NYC roles.
Two cautions limit the conclusion. First, these are means, not medians, so high earners influence them more strongly than they influence a midpoint. Second, the occupation excludes computer and information research scientists, whose work and pay can differ materially.
For a role outside the five boroughs but within commuting reach, the metro mean is usually more relevant than the statewide mean. For a role far upstate, neither figure should be presented as a local offer prediction. Geography has to match the labor market where the employer hires.
Pick the Right Benchmark for Your Own Offer
A market median describes the middle of a distribution where the bottom and top pay very differently. The BLS Occupational Employment and Wage Statistics metro estimates place the May 2025 median for data scientists in the New York–Newark–Jersey City area at $135,980, with the 10th percentile at $79,870, the 25th percentile at $101,320, and the 90th percentile at $216,030. A new graduate or career changer who reads the median as an expected first offer is looking at the wrong part of that distribution, because it combines workers across experience levels, industries, and levels of responsibility.
| Your situation | Figure to anchor on | Why it fits |
|---|---|---|
| New graduate or first data science role | 10th to 25th percentile, $79,870 to $101,320 | Entry offers sit in the lower tail of the distribution |
| Analyst moving into data science | 25th percentile to median, $101,320 to $135,980 | Applied analysis experience moves you up from the entry band |
| Data scientist owning production machine learning | Median to 90th percentile, $135,980 to $216,030 | Deployed models and ownership push offers toward the top |
| Applying to City of New York government | Posted range, $87,743 to $100,904 | Public salaries are published as fixed ranges |
How to Use the Bands
An analyst moving from statistics, reporting, or business intelligence brings transferable evidence: stakeholder work, SQL, experimentation, or production reporting. That record can justify looking above the entry band, but it doesn't automatically justify the median. The stronger test is whether prior work already includes modeling, deployment, or decisions that resemble the target role.
A candidate who has shipped models and owned measurable outcomes competes on documented scope rather than analytical potential. That candidate can reasonably examine the range from the median toward the upper tail, while still matching the claim to evidence of what was delivered.
The gap between the 10th and 90th percentiles is $136,160, wider than the entire national median of $120,230 reported in the Bureau of Labor Statistics data scientists profile. That spread is the central fact about this market. It shows why quoting one midpoint can mislead both a newcomer setting expectations and an employer trying to price a specialized role.
Readers comparing adjacent occupations can also review Mojolin's tech salaries by role before deciding whether a data science title is the right comparison. On an application, the defensible format is the band, the source, the geography, and the year.
What Moves an Offer Within the Range
Experience and scope usually explain placement better than the job title alone. Two employers can both advertise a data scientist role while expecting very different work, one centered on dashboards and ad hoc analysis, the other on models that run in production and affect revenue, risk, or operations.
Scope, Credentials, and Employer Type
- Production ownership: Building, deploying, and monitoring models usually supports a higher placement than analysis alone because the role carries operational risk.
- Degree and research depth: A PhD or published research record can support the upper part of a band when the job requires that depth, but it doesn't replace shipped work.
- Employer type: Finance, large technology firms, healthcare, and consulting often structure pay differently from government and nonprofits, even for similar technical work.
- Industry context: Domain knowledge in areas such as fraud, underwriting, clinical data, or marketplace pricing can matter when errors carry direct financial or regulatory costs.
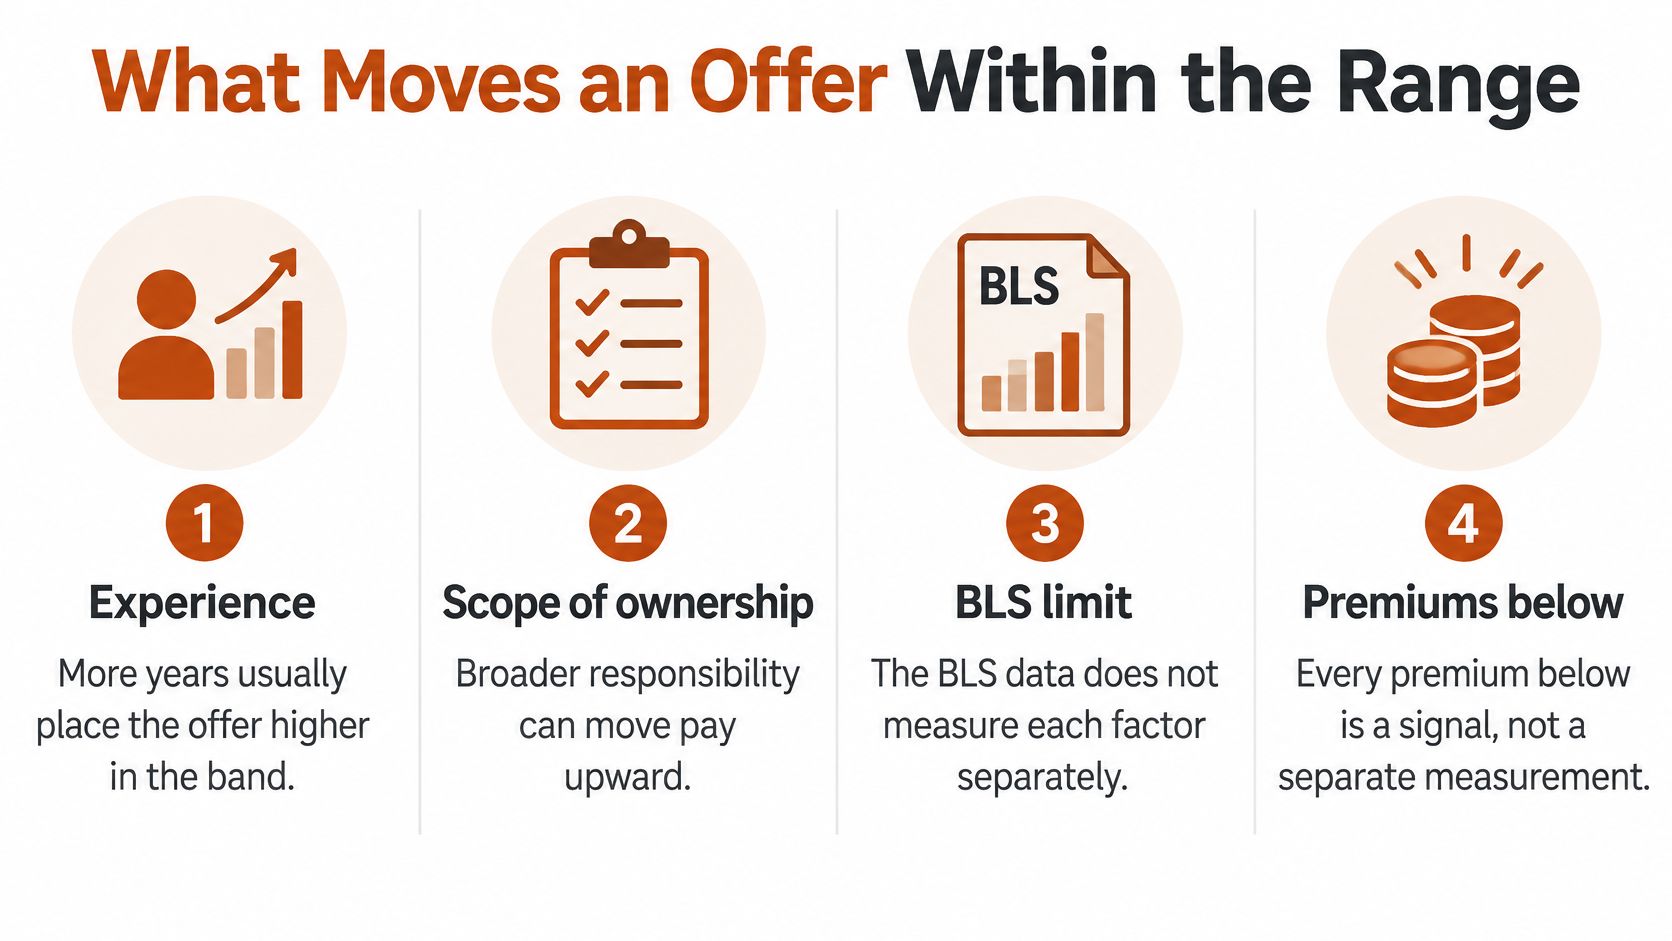
The BLS figures don't measure each factor separately. Any premium assigned to Python, cloud platforms, experimentation, or a graduate degree is therefore a judgement about a particular role, not a separate published measurement. That limit should be stated plainly during negotiation rather than hidden behind false precision.
Pay outside base salary also changes placement. Bonus, equity, and signing payments may make a lower base competitive, or they may be uncertain enough that they shouldn't close a large base gap. Readers can inspect the occupational definition and related duties on Mojolin's data scientist role page before assuming two postings describe equivalent work.
An offer is easier to evaluate after naming what the role owns, what the team ships, what the employer pays beyond base, and where that combination falls in the band.
That checklist keeps the discussion tied to evidence. A candidate with notebooks but no deployed system shouldn't borrow the benchmark for production ownership. A candidate who owns a live model shouldn't accept an analysis-only explanation without asking why.
Public and Private Employer Pay Compared
Public postings and private salary pages answer different questions. A government posting states the employer's authorized range for a specific vacancy. A private salary average summarizes what respondents report across many employers, roles, and experience levels.
The NYC Jobs data scientist posting listed a salary range of $87,743 to $100,904 in 2026. The top of that range sits just below the metro 25th percentile. That placement doesn't make the city job underpriced by definition, because the posting describes one role, one grade structure, and one employer's constraints.
The Private-Market Comparison
Built In's employee-reported average sits near the earlier metro mean, but the similarity shouldn't be overread. The government survey and anonymous employee responses use different samples and methods. The private figure can show what respondents report in New York City, while the BLS estimate describes an occupational population across the wider metro area.
Built In also reports average additional cash compensation separately. Those two averages should not be added and presented as a verified total package. The respondents behind each average may not represent the same people, job levels, or compensation arrangements.
- Fixed posted range: The City of New York figure is a published band for a vacancy.
- Self-reported average: The Built In figure summarizes anonymous employee responses.
- Separate cash average: Additional cash is reported on its own line and shouldn't be merged without knowing the underlying sample.
The public range also leaves out benefits and retirement terms that a salary band doesn't show. Pension value, healthcare contributions, leave, job security, and working hours can change the comparison, but they need separate valuation rather than guesswork. Private offers require the same treatment for equity vesting, bonus conditions, and signing-payment repayment terms.
Comparison order: Compare base ranges first, then evaluate bonus, benefits, equity, and retirement terms as separate components.
That order prevents a speculative equity value from disguising a weak base, and it prevents a government salary from being judged without its benefits. The sources become useful when each one is allowed to answer only the question it measures.
What the Figures Leave Out and How to Read Them
The main caution is the wage concept. The BLS occupational wage release reports annual wages for an occupational population, while technology compensation surveys may describe base pay, bonus and equity for self-selected respondents. Those measures answer different questions, so a higher survey average does not prove a higher market wage.
The national median also covers a different population from the New York metro estimates. It can orient a national role comparison, but it should not be used as an NYC offer benchmark.
Five Misreadings to Avoid
| Misreading | Why it misleads | Fix |
|---|---|---|
| Treating the median as a first offer | The median mixes junior and senior workers under one title | Quote the 10th to 25th percentile band for entry roles |
| Inferring an NYC median from the metro mean | Means are pulled up by high earners | Quote the published BLS median instead |
| Comparing the 2023 mean with the 2025 median | Different years and measures | Label the year and the measure on each number |
| Applying the national median to NYC | Different geography and distribution | Use the metro figures for NYC benchmarks |
| Mixing Built In averages with BLS wages | Self-reported averages differ from survey wages | Keep the sources on separate lines |
A single median hides the distance between junior and senior pay. None of the cited figures is split by years of experience, so the percentile bands are occupational estimates that locate a plausible range, not promises that an employer will offer a particular salary.
Geography and year create further traps. Metro figures cover the wider tri-state market, the national median describes a different worker population, and an earlier mean should not be read as a later median. Preserve the source year, geography, wage concept and equity scope before treating two numbers as comparable.
Mojolin carries the same limits. The pay and job figures on its role pages are US figures. Its BLS wages are national figures that exclude equity, signing bonuses and benefits, and they mix junior and senior people under one job title. Mojolin's pay, employment and outlook figures come from the U.S. Bureau of Labor Statistics Occupational Outlook Handbook, edition with 2025 pay and 2025 to 2035 projections.
Those labels matter when a reader moves from a national role page to an NYC negotiation. The national figure can frame a career comparison, while the metro percentile is the better local anchor. Confusing the two produces a precise-looking number with the wrong population behind it.
How to Anchor Your Number in a Negotiation
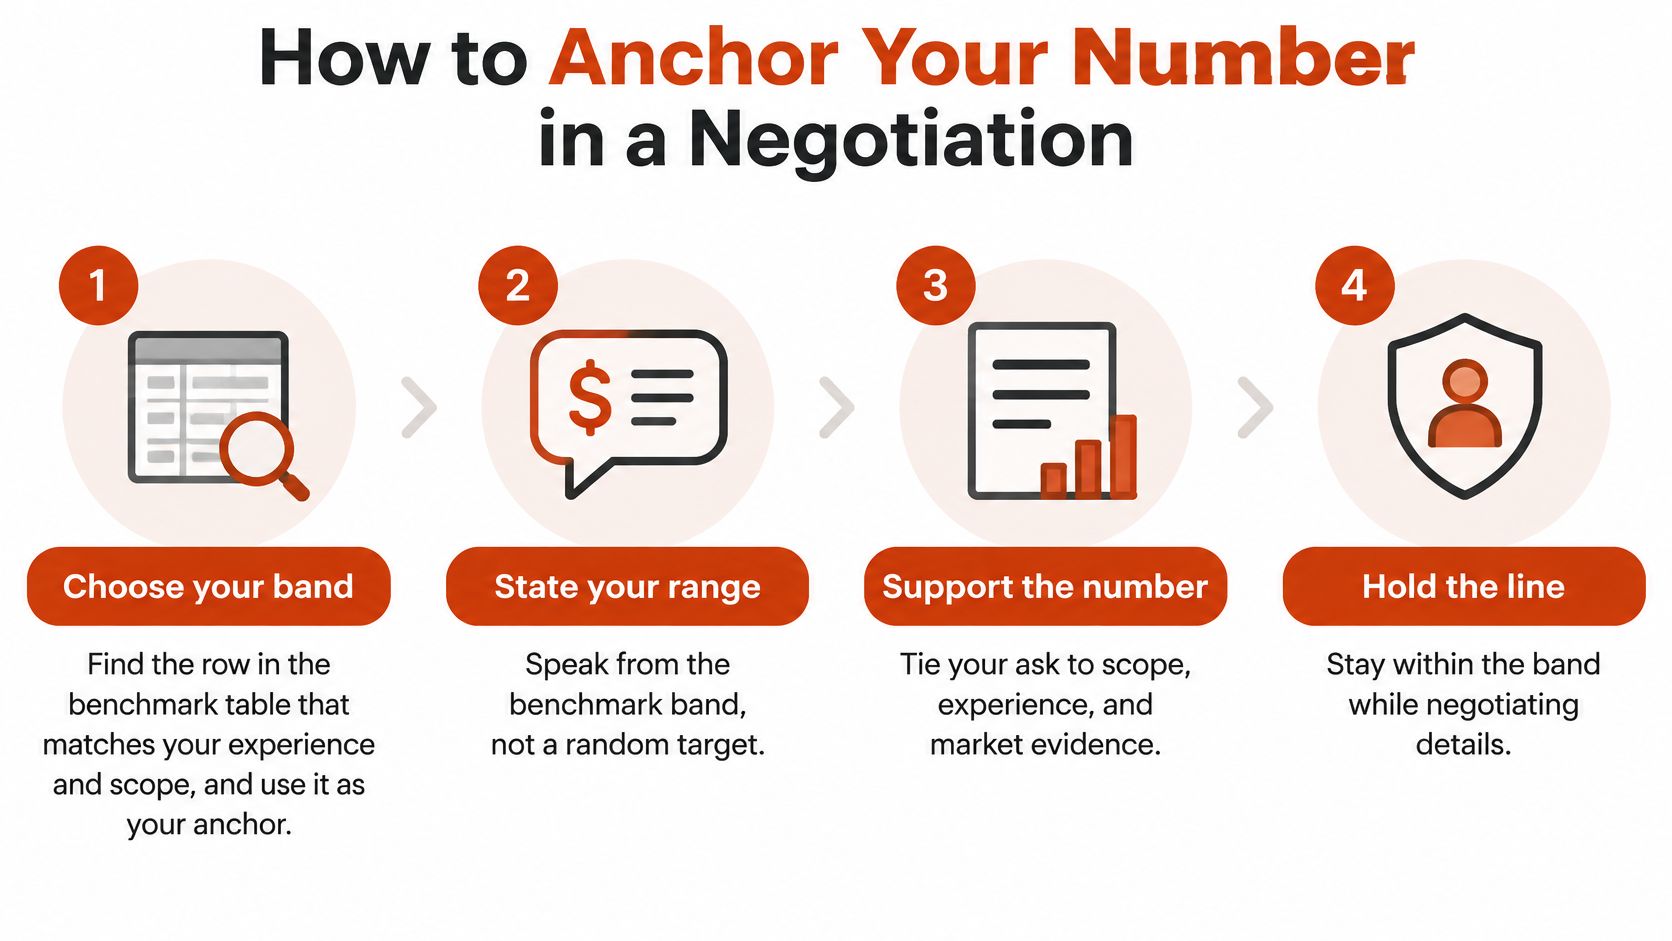
A negotiation anchor works when both sides can see its source, scope, and reasoning. The routine below turns the percentile bands into a sequence that can be used on an application, a recruiter call, or an offer discussion.
A Six-Step Routine
- Choose the band. Match experience and scope to the benchmark table, using the lower percentile band for an entry role. The usual mistake is selecting the median because it's the most visible figure.
- Confirm the scope. Decide whether the discussion covers base salary only or total cash including bonus. Naming a number before that distinction is clear creates an avoidable mismatch.
- Ask whether a range is published. A City of New York posting provides an explicit band, and assuming it can be pushed beyond its top without new reasons weakens credibility. The pay range should be shared early, on the first call with the candidate.
- State the anchor with its label. Give the measure, geography, and year rather than a bare figure. Quoting the metro median as an expected first offer is the slip this step prevents.
- Ask what placed the offer in the band. Request the employer's reasoning on ownership, degree, employer type, or level. Accepting a figure without knowing its basis leaves nothing specific to answer.
- Compare complete offers. Weigh bonus, equity, benefits, retirement terms, and start date against base salary before responding. Judging base alone can reject a strong package or accept a weak one.
Interviewers should not ask candidates about their current or past salary. A market band tied to the role is a cleaner basis for discussion than a candidate's prior pay. Scorecards are kept as a record of why each hiring decision was made, so employers should also be able to explain how level and scope affected the offer.
Candidates who want a fuller preparation framework can use Mojolin's tech salary negotiation guide alongside the band selected here. The important discipline is consistency. The same scope, source, and role definition should carry from the first call through the written offer.
A specific response beats a general request for more money. Saying that production ownership, on-call responsibility, or regulated-industry experience supports a higher placement gives the employer a reason that can be checked against the job. It also reveals whether the disagreement concerns market data, job level, or internal budget.
Set Your NYC Salary Range Before You Apply
Write down one salary range before the first application or recruiter call. Use the entry percentile band for a first data science role, the lower-to-middle band for an analyst moving into the field, or the employer's published range for city government.
Adjust within that band for scope, degree, and employer type. Then write the source and year beside it. A usable line reads: entry role, base $79,870 to $101,320, BLS metro, May 2025. Base and total cash stay on separate lines so an employer can't substitute one for the other.
Don't use the national median as a stand-in for an NYC range, and don't treat a metro mean as a median. Data scientist jobs are projected to grow 35% from 2025 to 2035, the fastest projected growth among the tech roles Mojolin tracks. Each role page on Mojolin compares that role's median pay against the other 13 roles Mojolin tracks.
This week, draft the range on one line, mark what's included, and bring it to the first call. That small record turns a vague salary expectation into an evidence-based negotiating position.
Compare the data scientist path with other technology roles, check sourced pay and outlook figures, and prepare a defensible NYC range before applying by visiting Mojolin.