
The May 2025 California median annual wage for data scientists was $141,590, about 17.8% above the US median of $120,230, according to Bureau of Labor Statistics occupational wage figures. These are occupational wages, not guaranteed offers.
California contains several distinct labor markets, so the statewide median is a starting point, not a local salary anchor. A hiring range also depends on the role's responsibilities and the market where the job is based.
Keep the measures separate. A statewide median, a metropolitan mean, and an experience-based estimate describe different comparisons. Combining them into one California average obscures what each figure can support.
Table of Contents
- California Median and Percentile Wages
- Pay Measures and What Each One Means
- Regional Benchmarks for California Markets
- San Jose Mean Pay and Concentration
- National Median Employment and Outlook
- Los Angeles Pay by Experience Level
- Local Estimates and Conflicting Figures
- Find the Figure and Set a California Salary Anchor
California Median and Percentile Wages
California's May 2025 median annual wage for data scientists was $141,590. The state's 10th percentile was $77,480, and its 90th percentile was $224,920, according to BLS Occupational Employment and Wage Statistics state data. The national median was $120,230, about 17.8% below California's figure, according to the BLS Occupational Outlook Handbook.
California data scientist wages versus the US median, May 2025
| Figure | Annual wage | What it measures | Geography |
|---|---|---|---|
| California median | $141,590 | Half earned more and half earned less | California |
| California 10th percentile | $77,480 | Lower decile of surveyed wages | California |
| California 90th percentile | $224,920 | Upper decile of surveyed wages | California |
| US median | $120,230 | National median wage | United States |
| California decile spread | About $147,440 | Gap from 10th to 90th percentile | California |
These are official occupational statistics, not salary promises or mandatory offer levels. The median gives a statewide midpoint; the percentile figures show a wide range of reported wages. Neither identifies the salary a particular employer should offer.
Reading the distribution without inventing career levels
A percentile describes a worker's position in the wage distribution. It does not identify experience, degree, job level, or technical specialty.
An offer near the lower decile may fit a narrowly scoped position with close supervision. But the figure does not isolate new graduates or first-time data scientists, so it cannot serve as an official starting salary.
The same restraint applies at the upper end. Production machine-learning ownership, experimentation leadership, and responsibility for consequential business decisions may support a higher compensation discussion. They do not establish an automatic entitlement to the upper decile.
A role assessment can distinguish among these responsibilities:
- Supervised analysis: Cleaning data, running established analyses, and presenting findings with senior review.
- Independent modeling: Selecting features, validating models, comparing statistical performance, and explaining trade-offs.
- Operational ownership: Maintaining production models, diagnosing failures, and accepting responsibility for deployment decisions.
- Decision leadership: Designing experiments and translating uncertain results into recommendations that affect business priorities.
These categories help explain how a role is placed within a range. They are not additional wage statistics.
Separating wages from the offer package
The occupational figures do not represent the full value of equity, signing incentives, bonuses, or benefits. Keep each component visible when comparing an offer with the wage distribution.
For example, contingent equity is not interchangeable with the same amount of guaranteed cash. Vesting, liquidity, performance conditions, and continued employment affect what a candidate ultimately receives.
Benchmarking rule: Match recurring cash compensation to the relevant wage benchmark, then evaluate uncertain or long-term compensation separately.
California's statewide distribution provides context. A hiring manager still needs a benchmark that fits the role's local labor market.
Pay Measures and What Each One Means
A salary figure needs both a statistical label and a geographic label. Without them, even an accurately copied number can lead to the wrong compensation decision.
The statistical label answers what calculation produced the figure. The geographic label identifies whose wages were included.
The measures aren't interchangeable
- Median: The midpoint of the wage distribution. It's the appropriate starting measure when the question concerns the middle worker rather than the arithmetic average.
- Mean: Total measured wages divided by the number of workers. Highly compensated employees can lift it above the midpoint.
- Percentile: A position within the distribution. It helps describe placement, but doesn't independently establish seniority.
- Hourly rate: Compensation expressed per hour. An annual equivalent requires an explicit assumption about paid hours and shouldn't be presented as a guaranteed annual salary.
A metropolitan mean and a statewide median therefore answer different questions, even when both describe data scientists. Their difference reflects a change in geography as well as a change in calculation.
Similarly, an experience-band estimate belongs to the population and method used by its regional study. It can't be relabeled as a statewide percentile merely because its value looks plausible.
The source hierarchy
Verified occupational statistics should identify the public agency, release or reference period, occupation, geography, and measure. BLS figures and California Employment Development Department benchmarks belong in that category when their labels remain attached.
A secondary publisher's figure should remain a secondary estimate, even if it cites public statistics. A blog, training provider, or job board that doesn't explain whether its number is a mean, median, advertised salary, or self-reported total compensation shouldn't replace an identified occupational benchmark.
| Figure type | Appropriate use | Inappropriate use |
|---|---|---|
| Statewide occupational median | Broad compensation context | A guaranteed local offer |
| Metropolitan occupational mean | Understanding a specific employer market | A typical salary for every employee |
| Regional wage benchmark | Setting a location-sensitive range | A statewide percentile |
| Regional experience band | Assessing career-stage context | A promised promotion schedule |
| Secondary salary estimate | Cross-checking an identified pattern | Overriding a better-labeled official statistic |
This hierarchy doesn't mean official figures answer every hiring question. They still require interpretation, especially when responsibilities cross occupational boundaries or an employer competes across several locations.
The acceptance test is straightforward: a usable salary anchor names its source, reference year, geography, and measure. A figure missing those fields remains context, not the basis for an offer.
Regional Benchmarks for California Markets
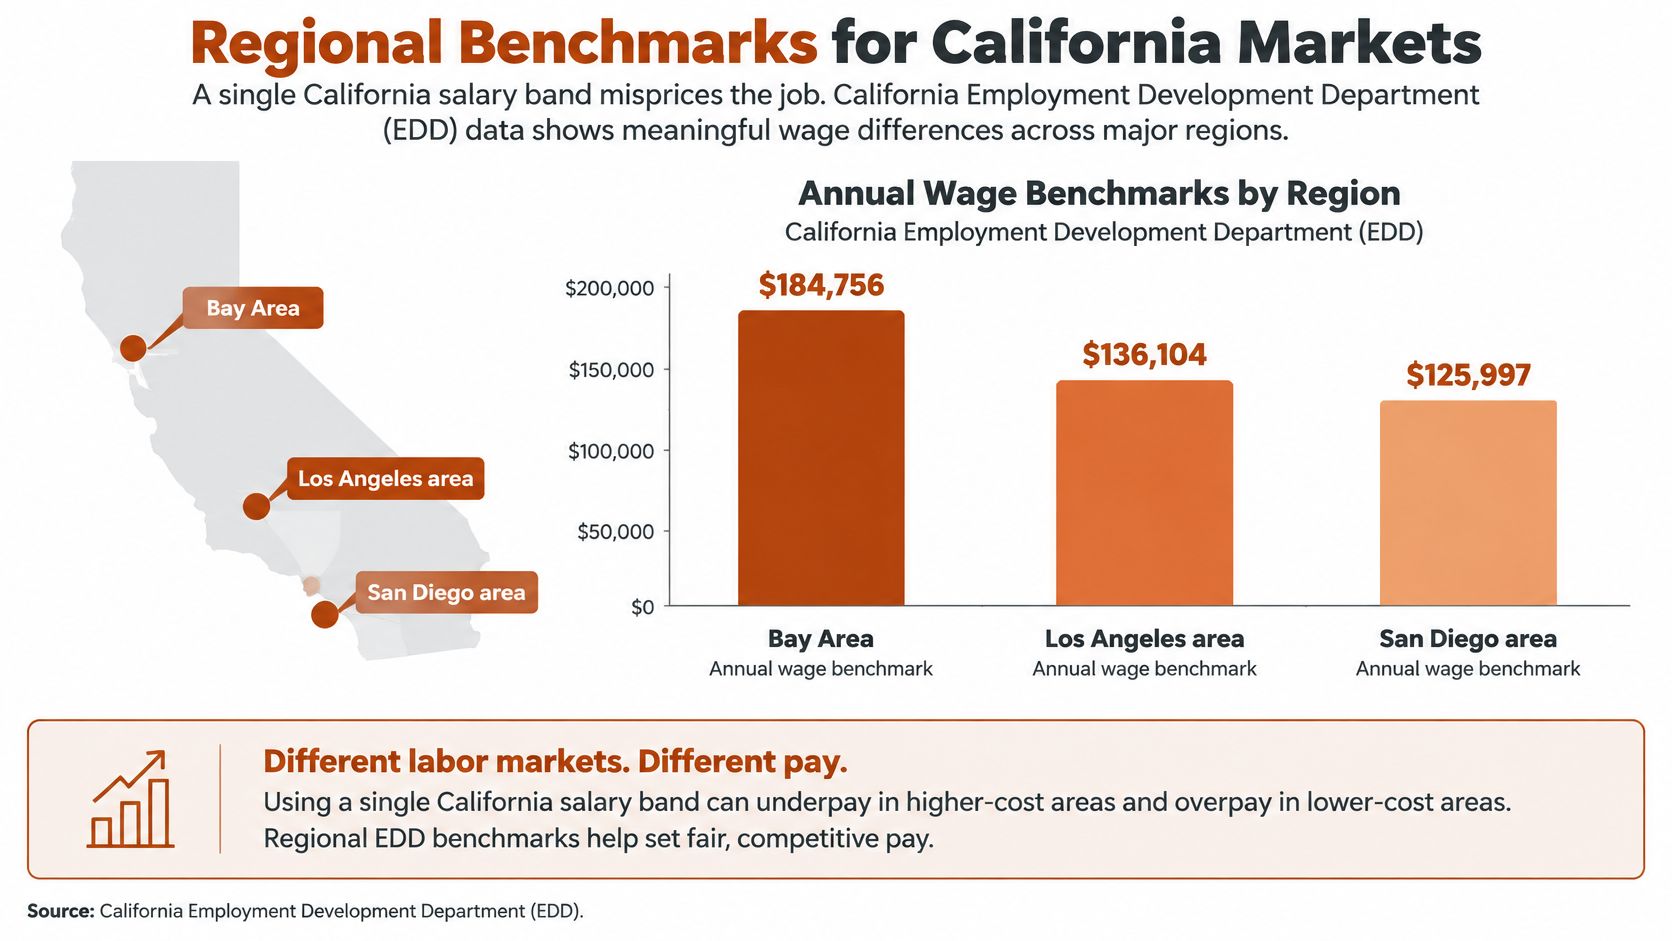
California's regional wage benchmarks show why a statewide figure can mislead: the median for data scientists differs substantially across the Bay Peninsula, Capital Region, and Inland Empire. The California Employment Development Department's occupational guide lists these annual regional benchmarks:
| Region | Lower benchmark | Median benchmark | Upper benchmark |
|---|---|---|---|
| Bay Peninsula | $140,093 | $176,428 | $217,877 |
| Capital Region | $85,131 | $101,137 | $122,043 |
| Inland Empire | $78,415 | $108,460 | $157,785 |
The Bay Peninsula median benchmark is higher than the Capital Region's by more than $75,000. The Inland Empire's median falls between them, while its upper benchmark reaches $157,785. These are regional occupational benchmarks, not statewide BLS percentiles.
The same title can require different hiring ranges
Consider a data scientist role responsible for production forecasting models: selecting features, testing model performance, monitoring behavior, and explaining changes to business leaders. For a Bay Peninsula search, the regional benchmarks provide a different starting point than they do for a Capital Region search. Specialization and competing offers may justify adjusting either range.
A single statewide band can therefore understate the benchmark in one market and overstate it in another. Location alone does not settle the question, though. A Capital Region candidate may also compete for jobs with employers recruiting beyond that area.
Documenting the actual labor market
Before setting a compensation band, define the market the employer is hiring in:
- Work location: Where the employee must work, including any required office presence.
- Competing employers: Which organizations offer comparable responsibilities.
- Recruiting reach: Whether the search is local, statewide, or open to candidates elsewhere.
- Job deliverables: Whether the employee supports analyses or owns models and their business consequences.
- Compensation basis: Whether the range describes base pay or total direct compensation.
A scorecard should assess observable work rather than title alone. Relevant categories include data processing, programming, visualization, model validation, feature selection, and communication with decision-makers.
The salary anchor should reflect the market where the candidate's realistic alternatives exist. If those alternatives fall outside the employer's chosen region, document the adjustment rather than treating a statewide figure as decisive.
San Jose Mean Pay and Concentration
San Jose–Sunnyvale–Santa Clara's mean annual wage for data scientists was $212,760 in May 2025, equivalent to $102.29 per hour, according to the BLS metropolitan occupational employment and wage release. That release reported an all-occupation mean of $57.32 per hour, placing data scientists about 78% above the metropolitan average.
The same release counted 6,060 data scientists and reported an employment location quotient of 3.16. In practical terms, data-scientist employment was more than three times as concentrated there as in the national workforce.
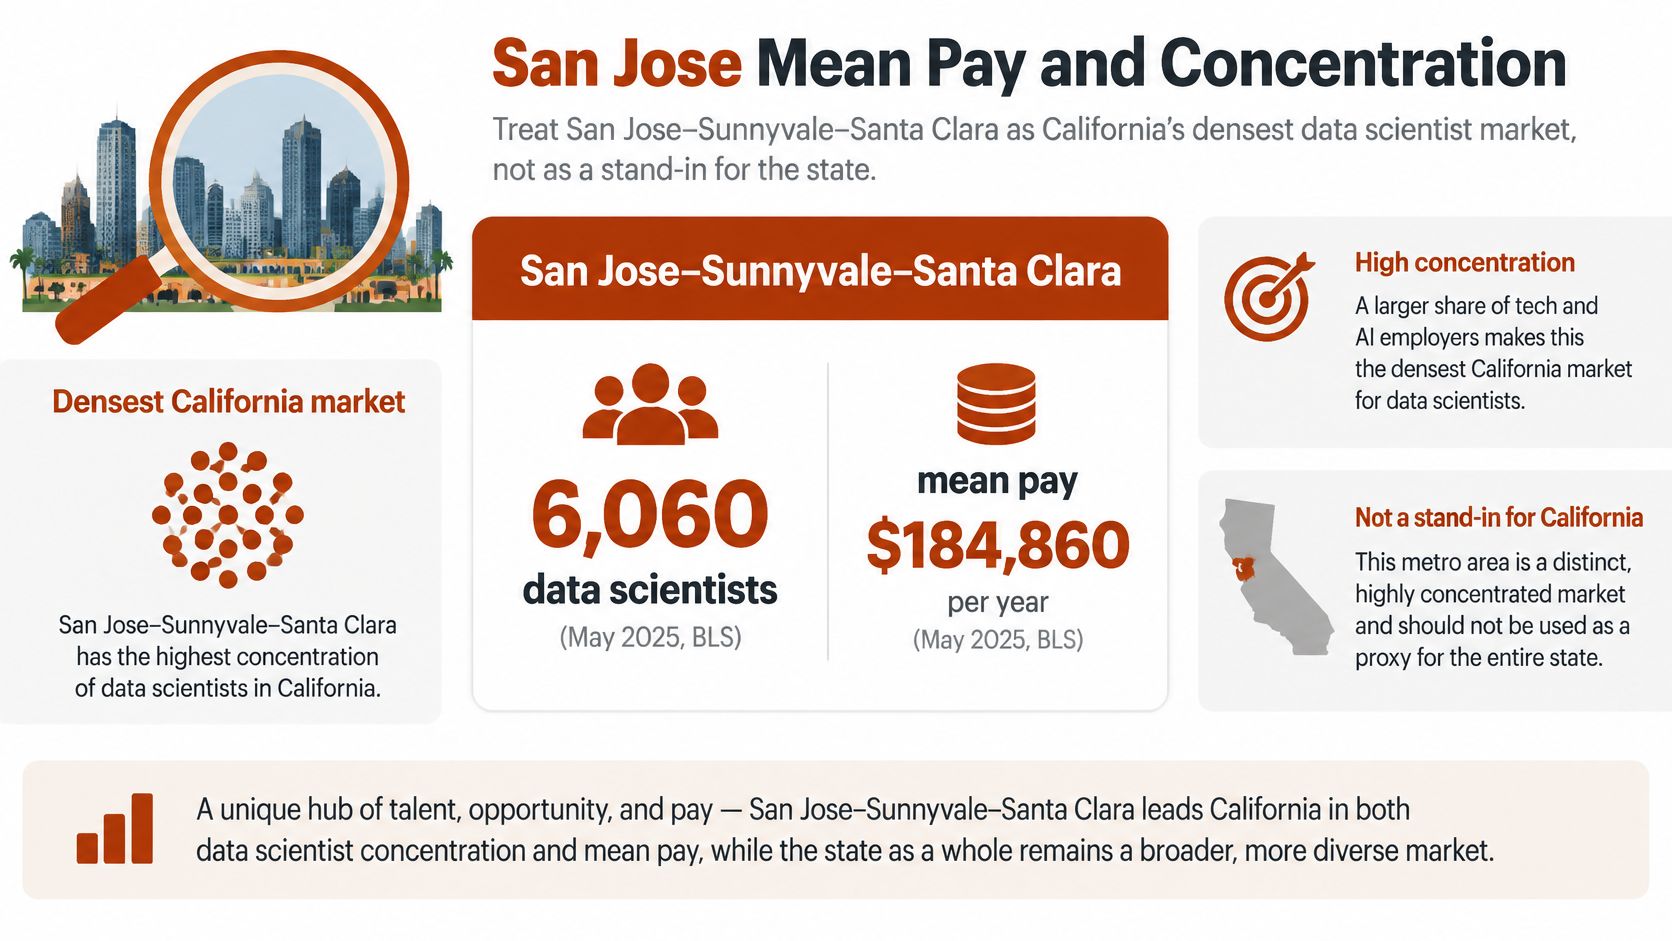
The combination matters more than either statistic alone. High mean pay describes compensation among employed workers; high concentration describes the occupation's relative presence in the local economy.
Neither establishes how many suitable vacancies a particular candidate can access. Employment concentration isn't a vacancy count, an acceptance rate, or evidence that an entry-level applicant can readily secure a position.
What the Silicon Valley premium supports
The region's employer mix includes software, cloud computing, artificial intelligence, finance, and semiconductor technology. These settings make specialization and production responsibility relevant considerations when evaluating compensation.
A candidate comparing offers should examine the work behind the title. Developing a model prototype, operating a production system, and directing an experimentation program create different responsibilities even when all appear under data scientist.
A hiring manager can use the metropolitan mean to understand the surrounding compensation environment. The manager can't use it as proof that every role must pay that amount, or that a candidate below it is necessarily underpaid.
A high metropolitan mean establishes a local wage premium. It doesn't establish the salary of every opening in that metro.
Why comparisons require restraint
Comparing this metropolitan mean directly with a statewide median changes the population and the statistical measure simultaneously. The resulting gap can't be interpreted as a pure location premium.
A clean geographic comparison would hold the measure, reference period, and occupational definition constant. A clean career-stage comparison would also isolate comparable responsibilities and experience.
That limits what a compensation editor should conclude. San Jose provides strong evidence that California contains a concentrated, high-paying technology labor market, but it doesn't justify applying Silicon Valley expectations to Sacramento or the Inland Empire.
For a candidate, the useful question is whether an offer reflects the responsibilities and alternatives available in that specific search. For an employer, the useful question is whether its budget competes for the people capable of delivering the required work.
National Median Employment and Outlook
The BLS Occupational Outlook Handbook reports a May 2025 national median annual wage of $120,230, or $57.80 per hour, for data scientists. The national May 2025 Occupational Employment and Wage Statistics figures summarized with that context report 262,440 employed data scientists and a mean annual wage of $126,800, or $60.96 per hour.
The difference between those measures explains why the word average is inadequate without clarification. An employer seeking a midpoint benchmark should not substitute an arithmetic mean.
BLS also projects 35% employment growth from 2025 through 2035, compared with 25% for mathematical-science occupations and 3% for all occupations, with approximately 24,800 data-scientist openings annually over the projection period from growth and replacement demand.
Strong demand isn't an individual hiring forecast
These are national occupational statistics. They describe the scale and projected direction of an occupation, not a promise about a particular California employer or applicant.
Growth and openings answer different questions. Growth describes projected expansion in employment, while openings also include positions associated with replacing workers who leave the occupation.
Neither figure establishes how many vacancies will accept an inexperienced applicant. Employers may seek capabilities that a new graduate hasn't yet demonstrated, including independent model validation, deployment judgment, or communication with operational decision-makers.
- Career planning: The outlook supports evaluating data science as an expanding occupation.
- Hiring budgets: Wage statistics establish compensation context, but don't specify the cost of filling a particular vacancy.
- Entry decisions: Candidates still need evidence that their skills match the work employers need performed.
National comparisons without a California starting-pay claim
Mojolin's pay, employment, and outlook figures come from the BLS Occupational Outlook Handbook edition with 2025 pay and 2025 to 2035 projections. Those wages are national, exclude equity, signing bonuses, and benefits, and combine junior and senior workers under one occupational title.
The technology salary comparison is therefore useful for comparing occupations on a common national basis. It shouldn't be interpreted as a California-specific offer schedule.
For California analysis, the national midpoint serves as a comparison baseline, not a legal or economic minimum. A specialized local market can sit well above it, while a narrower or early-career position can fall below it.
The analytical conclusion is narrower than a headline about rapid growth might suggest. Strong projected demand supports the occupation's long-term relevance, but it doesn't convert the national median into a California starting offer or eliminate competition for accessible roles.
Los Angeles Pay by Experience Level
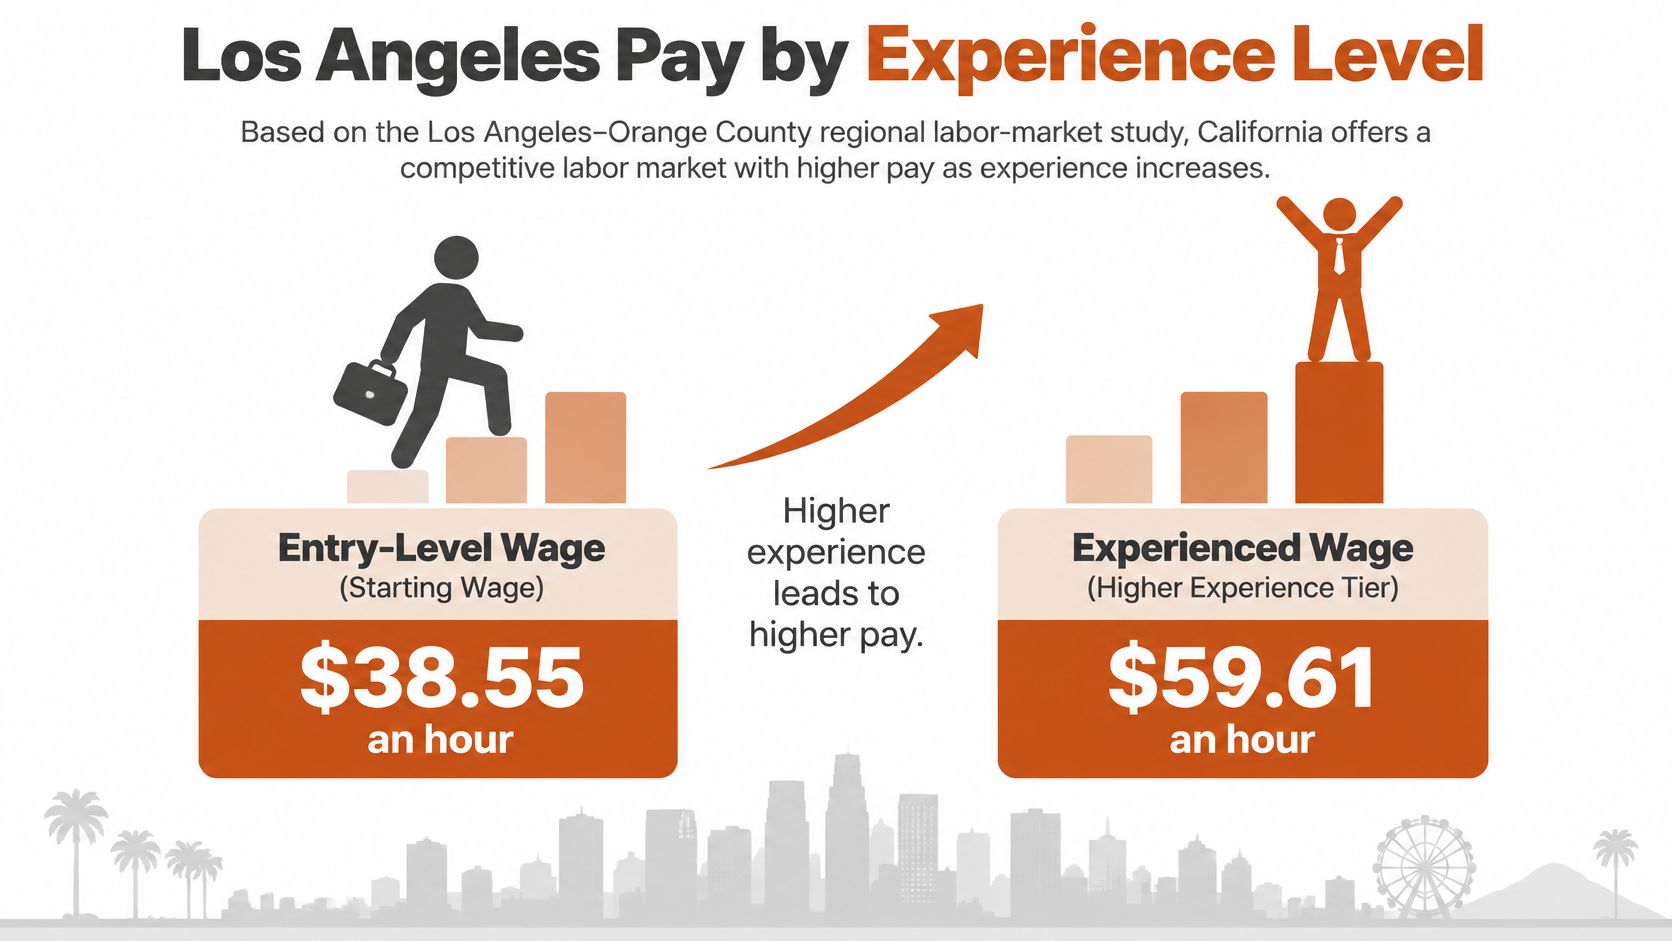
A Los Angeles–Orange County regional labor-market study reports data-scientist wages of $38.55 per hour for entry-level workers, $60.29 for typical workers, and $78.48 for experienced workers. At 2,080 hours a year, those rates equal approximately $80,184, $125,403, and $163,238.
The study also reports 2,119 projected annual openings through 2028 and about 2,189 related credentials awarded annually. Those figures put training output and projected openings in similar ranges, but they do not show how many graduates will seek local jobs or qualify for them.
Los Angeles–Orange County data scientist wages by experience level
| Experience band | Hourly rate | Annual at 2,080 hours |
|---|---|---|
| Entry-level | $38.55 | About $80,184 |
| Typical | $60.29 | About $125,403 |
| Experienced | $78.48 | About $163,238 |
These are regional study wage bands, with annual equivalents calculated from the hourly rates. They are not statewide BLS percentiles, guaranteed starting offers, or forecasts of pay after a set number of years.
Credentials and openings aren't equivalent populations
The openings-versus-credentials comparison is not an unemployment forecast. A credential may not represent a unique job seeker, and graduates may pursue adjacent occupations, continue studying, or search outside the region. Openings also compete with experienced applicants and workers changing employers.
For employers, similar counts do not establish that every credentialed candidate is ready for the work. For candidates, a credential alone does not establish eligibility for the wage bands. Evidence of relevant work matters.
The first foothold may carry another title
The regional study identifies data engineering, data analysis, business systems analysis, and business intelligence among frequently posted related occupations. These roles may fit candidates whose demonstrated strengths are in data preparation, reporting, systems requirements, or business interpretation rather than independent modeling.
A portfolio can distinguish those capabilities. A SQL project that produces a reliable reporting dataset shows different skills from a modeling project with leakage checks, feature-selection rationale, baseline validation, and a deployment plan.
Candidates reviewing the data scientist role profile can compare the occupation with the responsibilities they have already performed. A related position may be a closer initial fit, though it does not guarantee progression into data science.
Entry-route test: Identify the work you can perform independently and the work that still requires supervision before choosing a salary band.
The study does not establish how long advancement takes. Credential volume, employer selectivity, specialization, and access to substantive project ownership can all affect a transition.
The relevant question is what evidence an employer expects for experienced-level responsibility, not whether a candidate holds a credential or has entered a related role.
Local Estimates and Conflicting Figures
A secondary figure can help check a pattern without becoming the compensation anchor. The distinction should remain visible even when the secondary publisher appears credible.
An eData Science report published on edX reports 36,850 California data scientists in 2024 and a statewide median annual salary of $136,800. Those figures belong to a secondary report with its own reference year and methodology, rather than the BLS statewide measure used for the primary anchor.
A discrepancy doesn't establish that either figure was copied incorrectly. Reference periods, revisions, source selection, and methodological differences all require examination before a compensation editor can explain the gap.
Resolving disagreement without manufacturing an average
A hiring manager shouldn't average conflicting figures to produce a compromise. That creates a new number without resolving whether the inputs measure the same thing.
The better approach is to preserve each figure's identity and determine which one answers the hiring question.
| Conflict | Editorial treatment |
|---|---|
| Different reference years | Retain the year beside each figure |
| Mean compared with median | Identify the different calculations |
| State compared with metro | Select the relevant labor market |
| Experience band compared with percentile | Keep the original population labels |
| Unnamed method or release | Exclude the figure from the anchor |
An unattributed statewide mean is especially weak evidence. Even a plausible number can't establish typical pay if its underlying release, population, and method aren't identifiable.
The same rule applies to a metropolitan figure circulating without a named release. A familiar city name doesn't compensate for missing statistical provenance.
What belongs in the final comparison
An offer worksheet should contain the selected official benchmark, its reference period, the geography, and a short explanation of role fit. Secondary estimates can occupy a separate context field.
If a secondary estimate conflicts with the selected occupational statistic, the worksheet should record that difference in words rather than conceal it through blending. A regional experience study should likewise remain regional context, not become a substitute statewide distribution.
The governing principle is traceability before precision. A well-labeled benchmark with clear limits is more useful than a highly specific salary estimate whose population can't be identified.
Find the Figure and Set a California Salary Anchor
A defensible compensation anchor is a documented decision, not the largest number found in a search result. The hiring manager and candidate should be able to explain why the selected measure fits the role.
A practical sequence for one position
Name the labor market. A statewide position may justify statewide context. A location-bound search should use the relevant region or metropolitan area, while a remote search needs an explicit policy identifying which competing labor market governs compensation.
Choose the measure that answers the question. A median addresses the midpoint; a named percentile describes placement. A mean can characterize the local employer environment, but it shouldn't be relabeled as typical pay.
Map responsibilities to the range. Document whether the employee performs supervised analysis, validates models independently, owns production behavior, or leads experiments with business consequences. Evidence should include decisions made, alternatives rejected, and results communicated, not merely a list of Python libraries.
Separate the offer components. State recurring base pay plainly, then list bonus conditions, equity terms, signing payments, and benefits. A candidate should be able to identify which compensation is guaranteed, contingent, deferred, or dependent on continued employment.
Check the national comparison. Use the national occupational midpoint to identify whether the proposed local anchor carries a premium or discount. A difference requires interpretation through location and responsibility, not an assumption that every California position must exceed the national figure.
State the anchor before negotiating details. The opening compensation discussion should identify geography, measure, and base versus total pay. Hiring teams should share the range early and evaluate role fit rather than ask candidates to justify it through past salary.
Turning the benchmark into a conversation
A useful anchor statement identifies the selected regional benchmark and explains the employee's proposed placement through concrete responsibilities. It should also state what would justify movement within the range, such as independent validation, production ownership, or broader decision authority.
The salary negotiation guide can support that preparation, but the candidate still needs a role-specific case. A notebook that runs successfully isn't the same evidence as a documented validation process, monitored deployment, and a clear account of business trade-offs.
For career comparisons, Mojolin's role pages compare each occupation's median pay with the other 13 roles it tracks. Data scientist employment has projected growth of 35% from 2025 through 2035, the fastest projected growth among those tracked technology roles, but that national outlook doesn't determine the price of a specific California vacancy.
A compensation discussion is ready when both parties can identify the labor market, statistical measure, responsibility level, and compensation components without ambiguity.
Mojolin combines official occupational statistics with practical guidance on technology careers, compensation, and hiring. Candidates and hiring managers comparing California data scientist opportunities can visit Mojolin to assess occupational pay context and prepare a negotiation anchored to the actual role rather than a statewide headline.